Scale Invariance Research: Consolidated Report
Complete End-to-End Analysis with Live Data
Generated: 2025-11-09 20:42:33
Abstract
This report presents a comprehensive scale invariance analysis across multiple assets.
Data Sources:
All financial data downloaded LIVE from Yahoo Finance API
NO hardcoded data points
ALL data cached locally for reproducibility
Total Assets Analyzed: 19
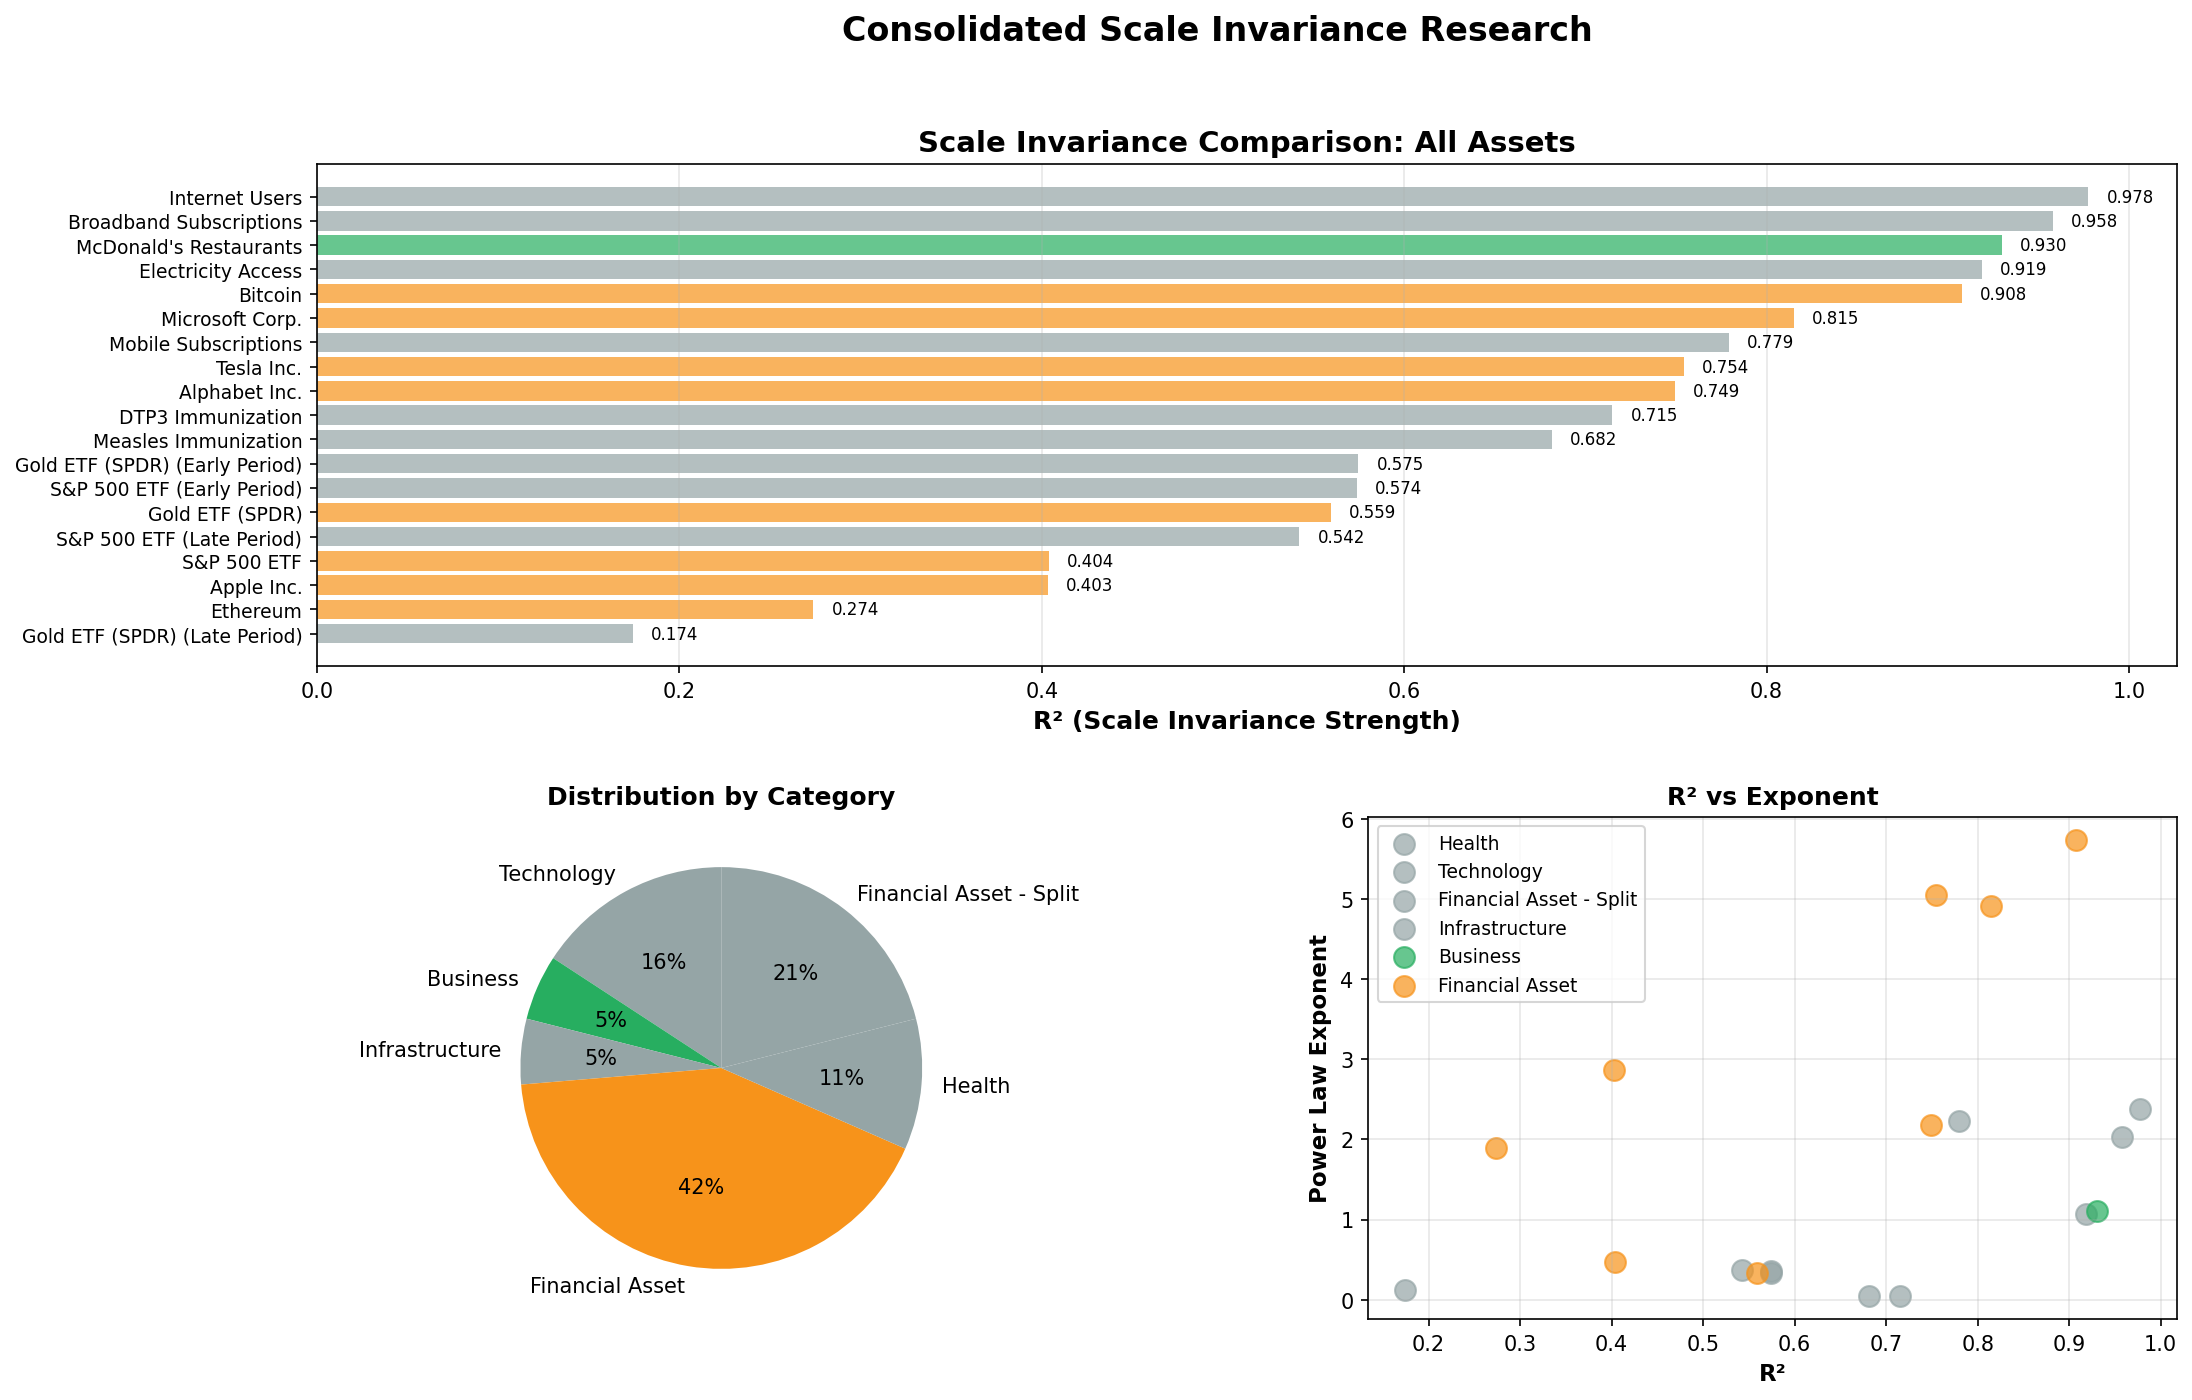
Overall Comparison
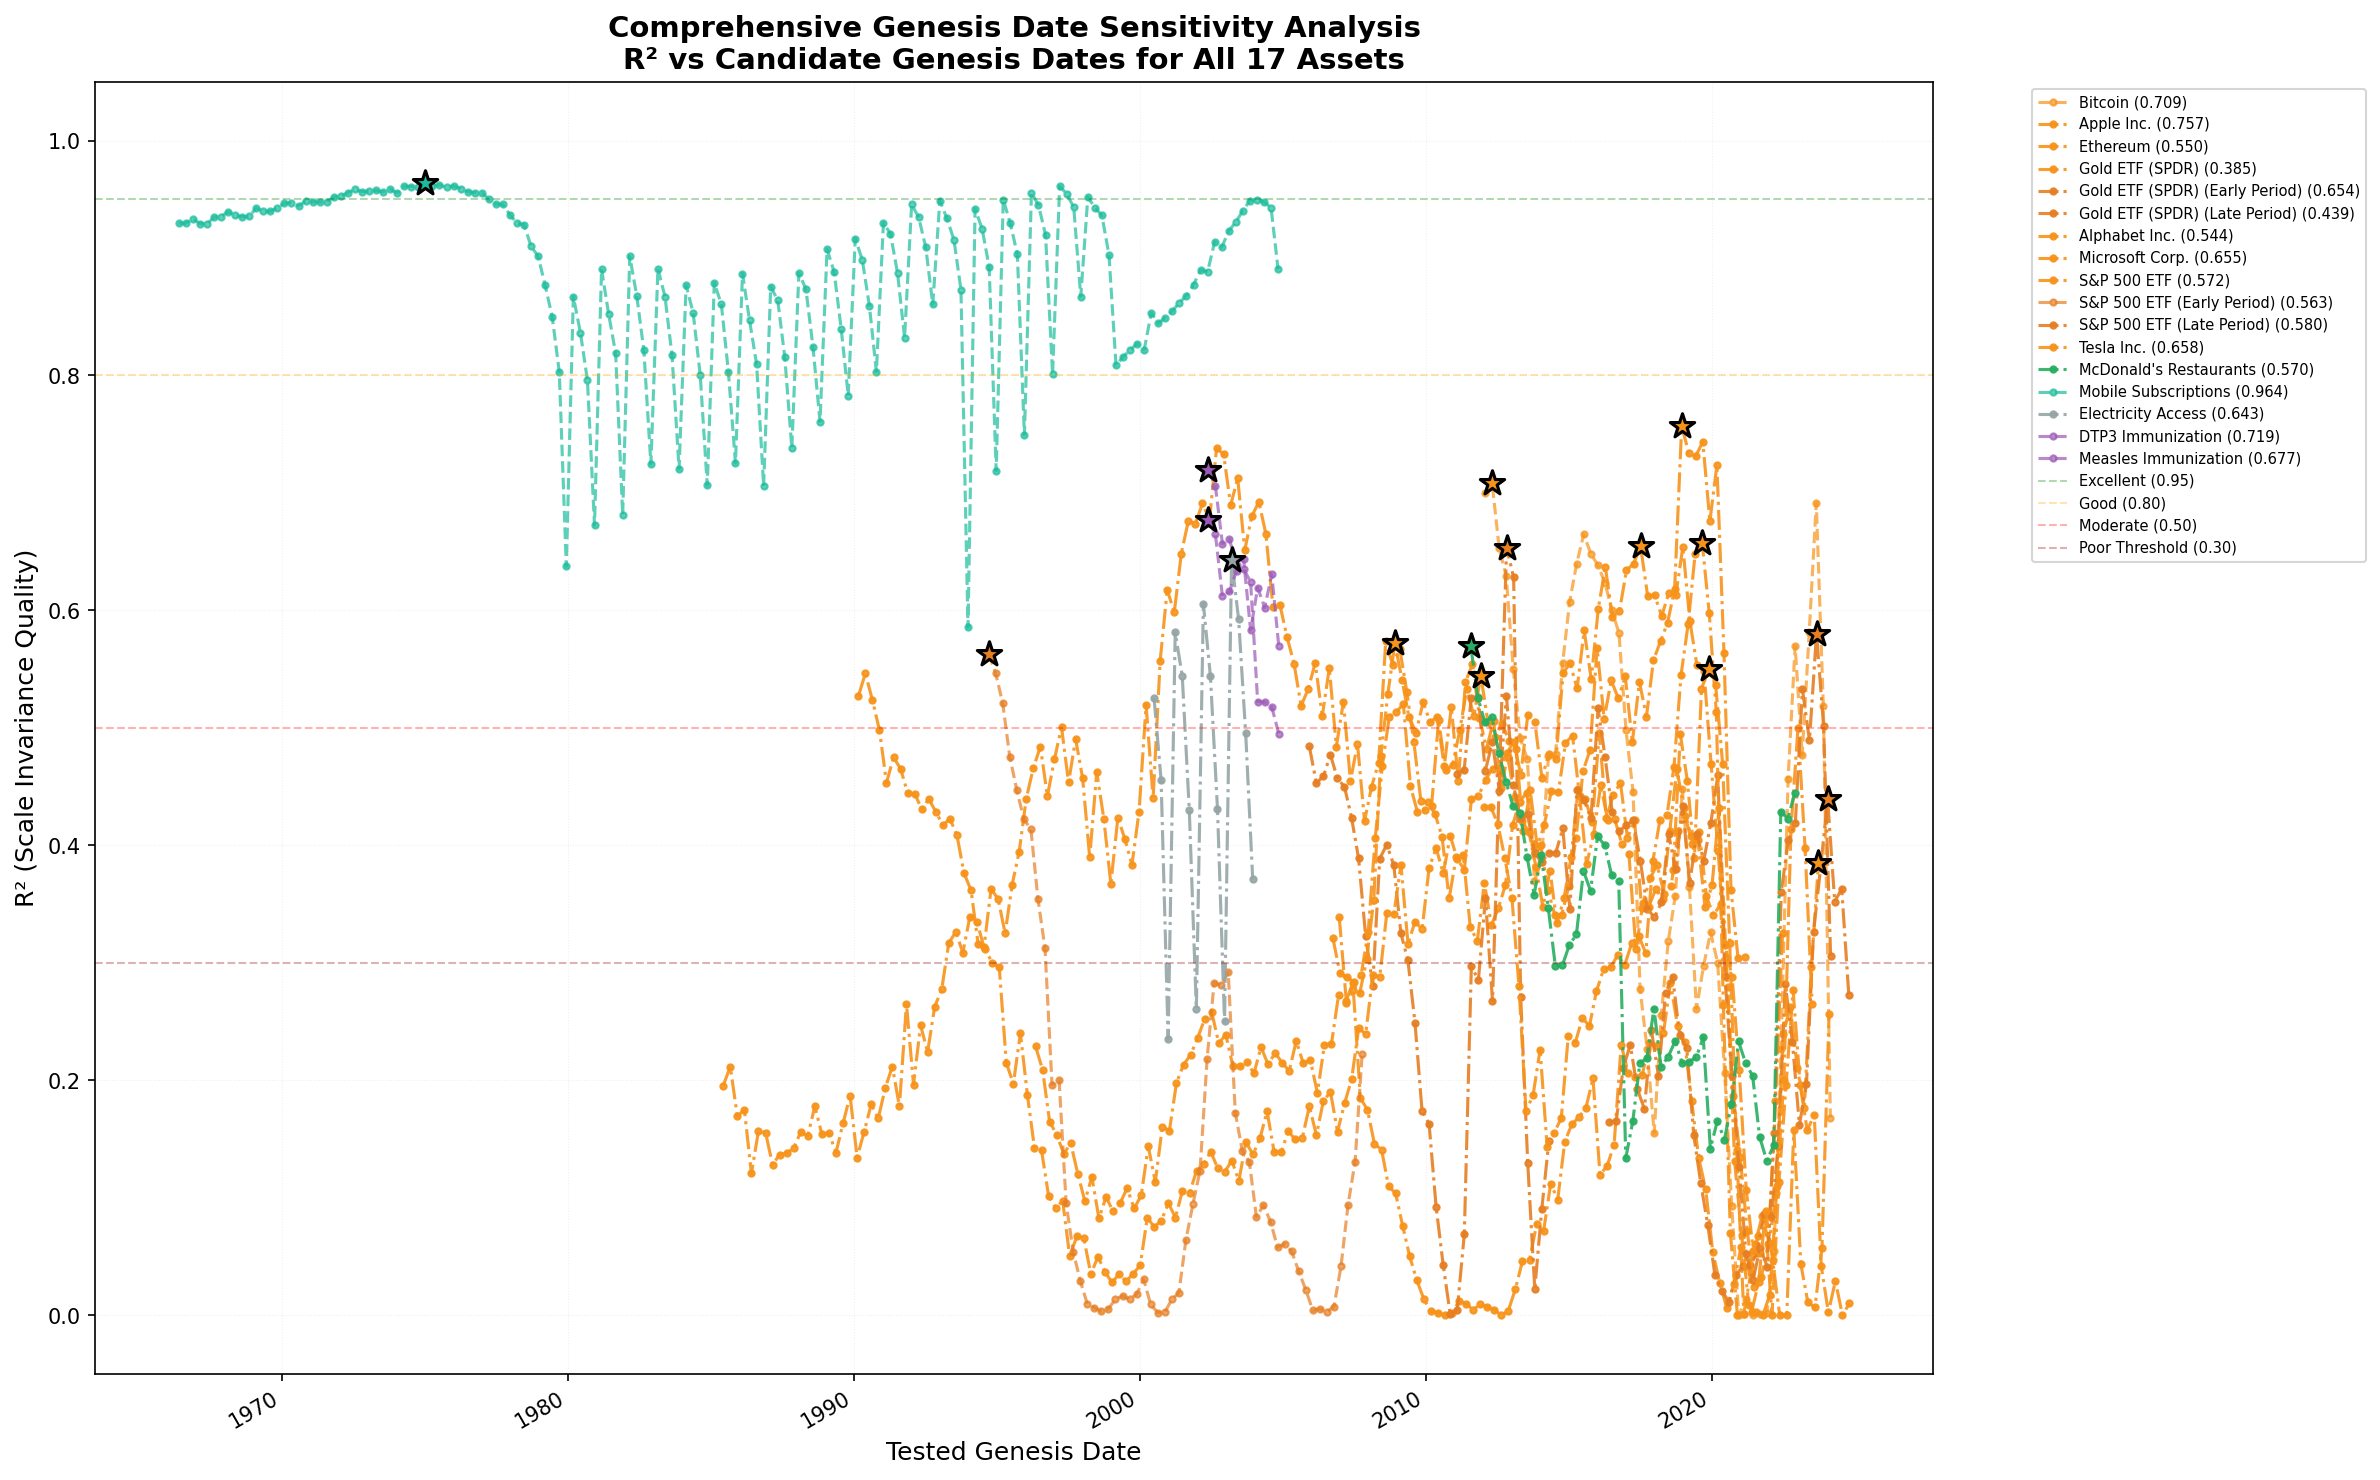
Genesis Sensitivity Overview
Scale invariance strength varies with the assumed genesis date. The chart below shows how R² responds across all tested dates for each asset where genesis optimization was performed.
Summary Table
| Asset |
Category |
R² |
Exponent |
Pattern |
Points |
Date Range |
Genesis |
Source |
| Internet Users |
Technology |
0.9776 |
2.38 |
⚡ Power-law |
20 |
2005-01-01 to 2024-01-01 |
1983-01-01 (Provided) |
World Bank API (IT.NET.USER.ZS) |
| Broadband Subscriptions |
Technology |
0.9580 |
2.03 |
⚡ Power-law |
20 |
2005-01-01 to 2024-01-01 |
1990-01-01 (Provided) |
World Bank API (IT.NET.BBND.P2) |
| McDonald's Restaurants |
Business |
0.9301 |
1.10 |
⚡ Power-law |
130 |
2009-12-31 to 2025-09-30 |
1955-04-15 (Provided) |
Downloaded from SEC EDGAR (CIK: 0000063908), us |
| Electricity Access |
Infrastructure |
0.9188 |
1.06 |
⚡ Power-law |
26 |
1998-01-01 to 2023-01-01 |
1880-01-01 (Provided) |
World Bank API (EG.ELC.ACCS.ZS) |
| Bitcoin |
Financial Asset |
0.9079 |
5.74 |
⚡ Power-law |
5566 |
2010-07-18 to 2025-11-09 |
2009-01-03 (Provided) |
btcpricehistory.csv (repository data) |
| Microsoft Corp. |
Financial Asset |
0.8151 |
4.91 |
⚡ Power-law |
9993 |
1986-03-13 to 2025-11-07 |
1975-04-04 (Provided) |
Yahoo Finance API (yfinance Python library) |
| Mobile Subscriptions |
Technology |
0.7794 |
2.23 |
✅ Saturated (103%) |
36 |
1984-01-01 to 2024-01-01 |
1983-10-13 (Provided) |
World Bank API (IT.CEL.SETS.P2) |
| Tesla Inc. |
Financial Asset |
0.7543 |
5.05 |
✅ Saturated (171%) |
3866 |
2010-06-29 to 2025-11-07 |
2003-07-01 (Provided) |
Yahoo Finance API (yfinance Python library) |
| Alphabet Inc. |
Financial Asset |
0.7494 |
2.18 |
⚡ Power-law |
5341 |
2004-08-19 to 2025-11-07 |
1998-09-04 (Provided) |
Yahoo Finance API (yfinance Python library) |
| DTP3 Immunization |
Health |
0.7149 |
0.05 |
✅ Saturated (757%) |
22 |
2003-01-01 to 2024-01-01 |
2002-05-26 (Optimized vs published) |
WHO API (WHS4_100) |
| Measles Immunization |
Health |
0.6815 |
0.04 |
✅ Saturated (735%) |
22 |
2003-01-01 to 2024-01-01 |
2002-05-26 (Optimized vs published) |
WHO API (WHS4_544) |
| Gold ETF (SPDR) (Early Period) |
Financial Asset - Split |
0.5747 |
0.33 |
🔹 Early |
2639 |
2004-11-18 to 2015-05-14 |
2004-11-18 (Provided) |
Yahoo Finance API (yfinance Python library) |
| S&P 500 ETF (Early Period) |
Financial Asset - Split |
0.5739 |
0.36 |
🔹 Early |
4126 |
1993-01-29 to 2009-06-16 |
1993-01-22 (Provided) |
Yahoo Finance API (yfinance Python library) |
| Gold ETF (SPDR) |
Financial Asset |
0.5594 |
0.34 |
🏒 Hockey (3.6x) |
5277 |
2004-11-18 to 2025-11-07 |
2004-11-18 (Provided) |
Yahoo Finance API (yfinance Python library) |
| S&P 500 ETF (Late Period) |
Financial Asset - Split |
0.5422 |
0.37 |
🔹 Late |
4126 |
2009-06-17 to 2025-11-07 |
2009-06-17 (Hockey Stick Inflection) |
Yahoo Finance API (yfinance Python library) |
| S&P 500 ETF |
Financial Asset |
0.4041 |
0.48 |
🏒 Hockey (7.7x) |
8252 |
1993-01-29 to 2025-11-07 |
1993-01-22 (Provided) |
Yahoo Finance API (yfinance Python library) |
| Apple Inc. |
Financial Asset |
0.4032 |
2.87 |
📈 S-curve (89%) |
11319 |
1980-12-12 to 2025-11-07 |
1976-04-01 (Provided) |
Yahoo Finance API (yfinance Python library) |
| Ethereum |
Financial Asset |
0.2740 |
1.90 |
✅ Saturated (152%) |
2921 |
2017-11-09 to 2025-11-07 |
2015-07-30 (Provided) |
Yahoo Finance API (yfinance Python library) |
| Gold ETF (SPDR) (Late Period) |
Financial Asset - Split |
0.1743 |
0.12 |
🔹 Late |
2638 |
2015-05-15 to 2025-11-07 |
2015-05-15 (Hockey Stick Inflection) |
Yahoo Finance API (yfinance Python library) |
Business
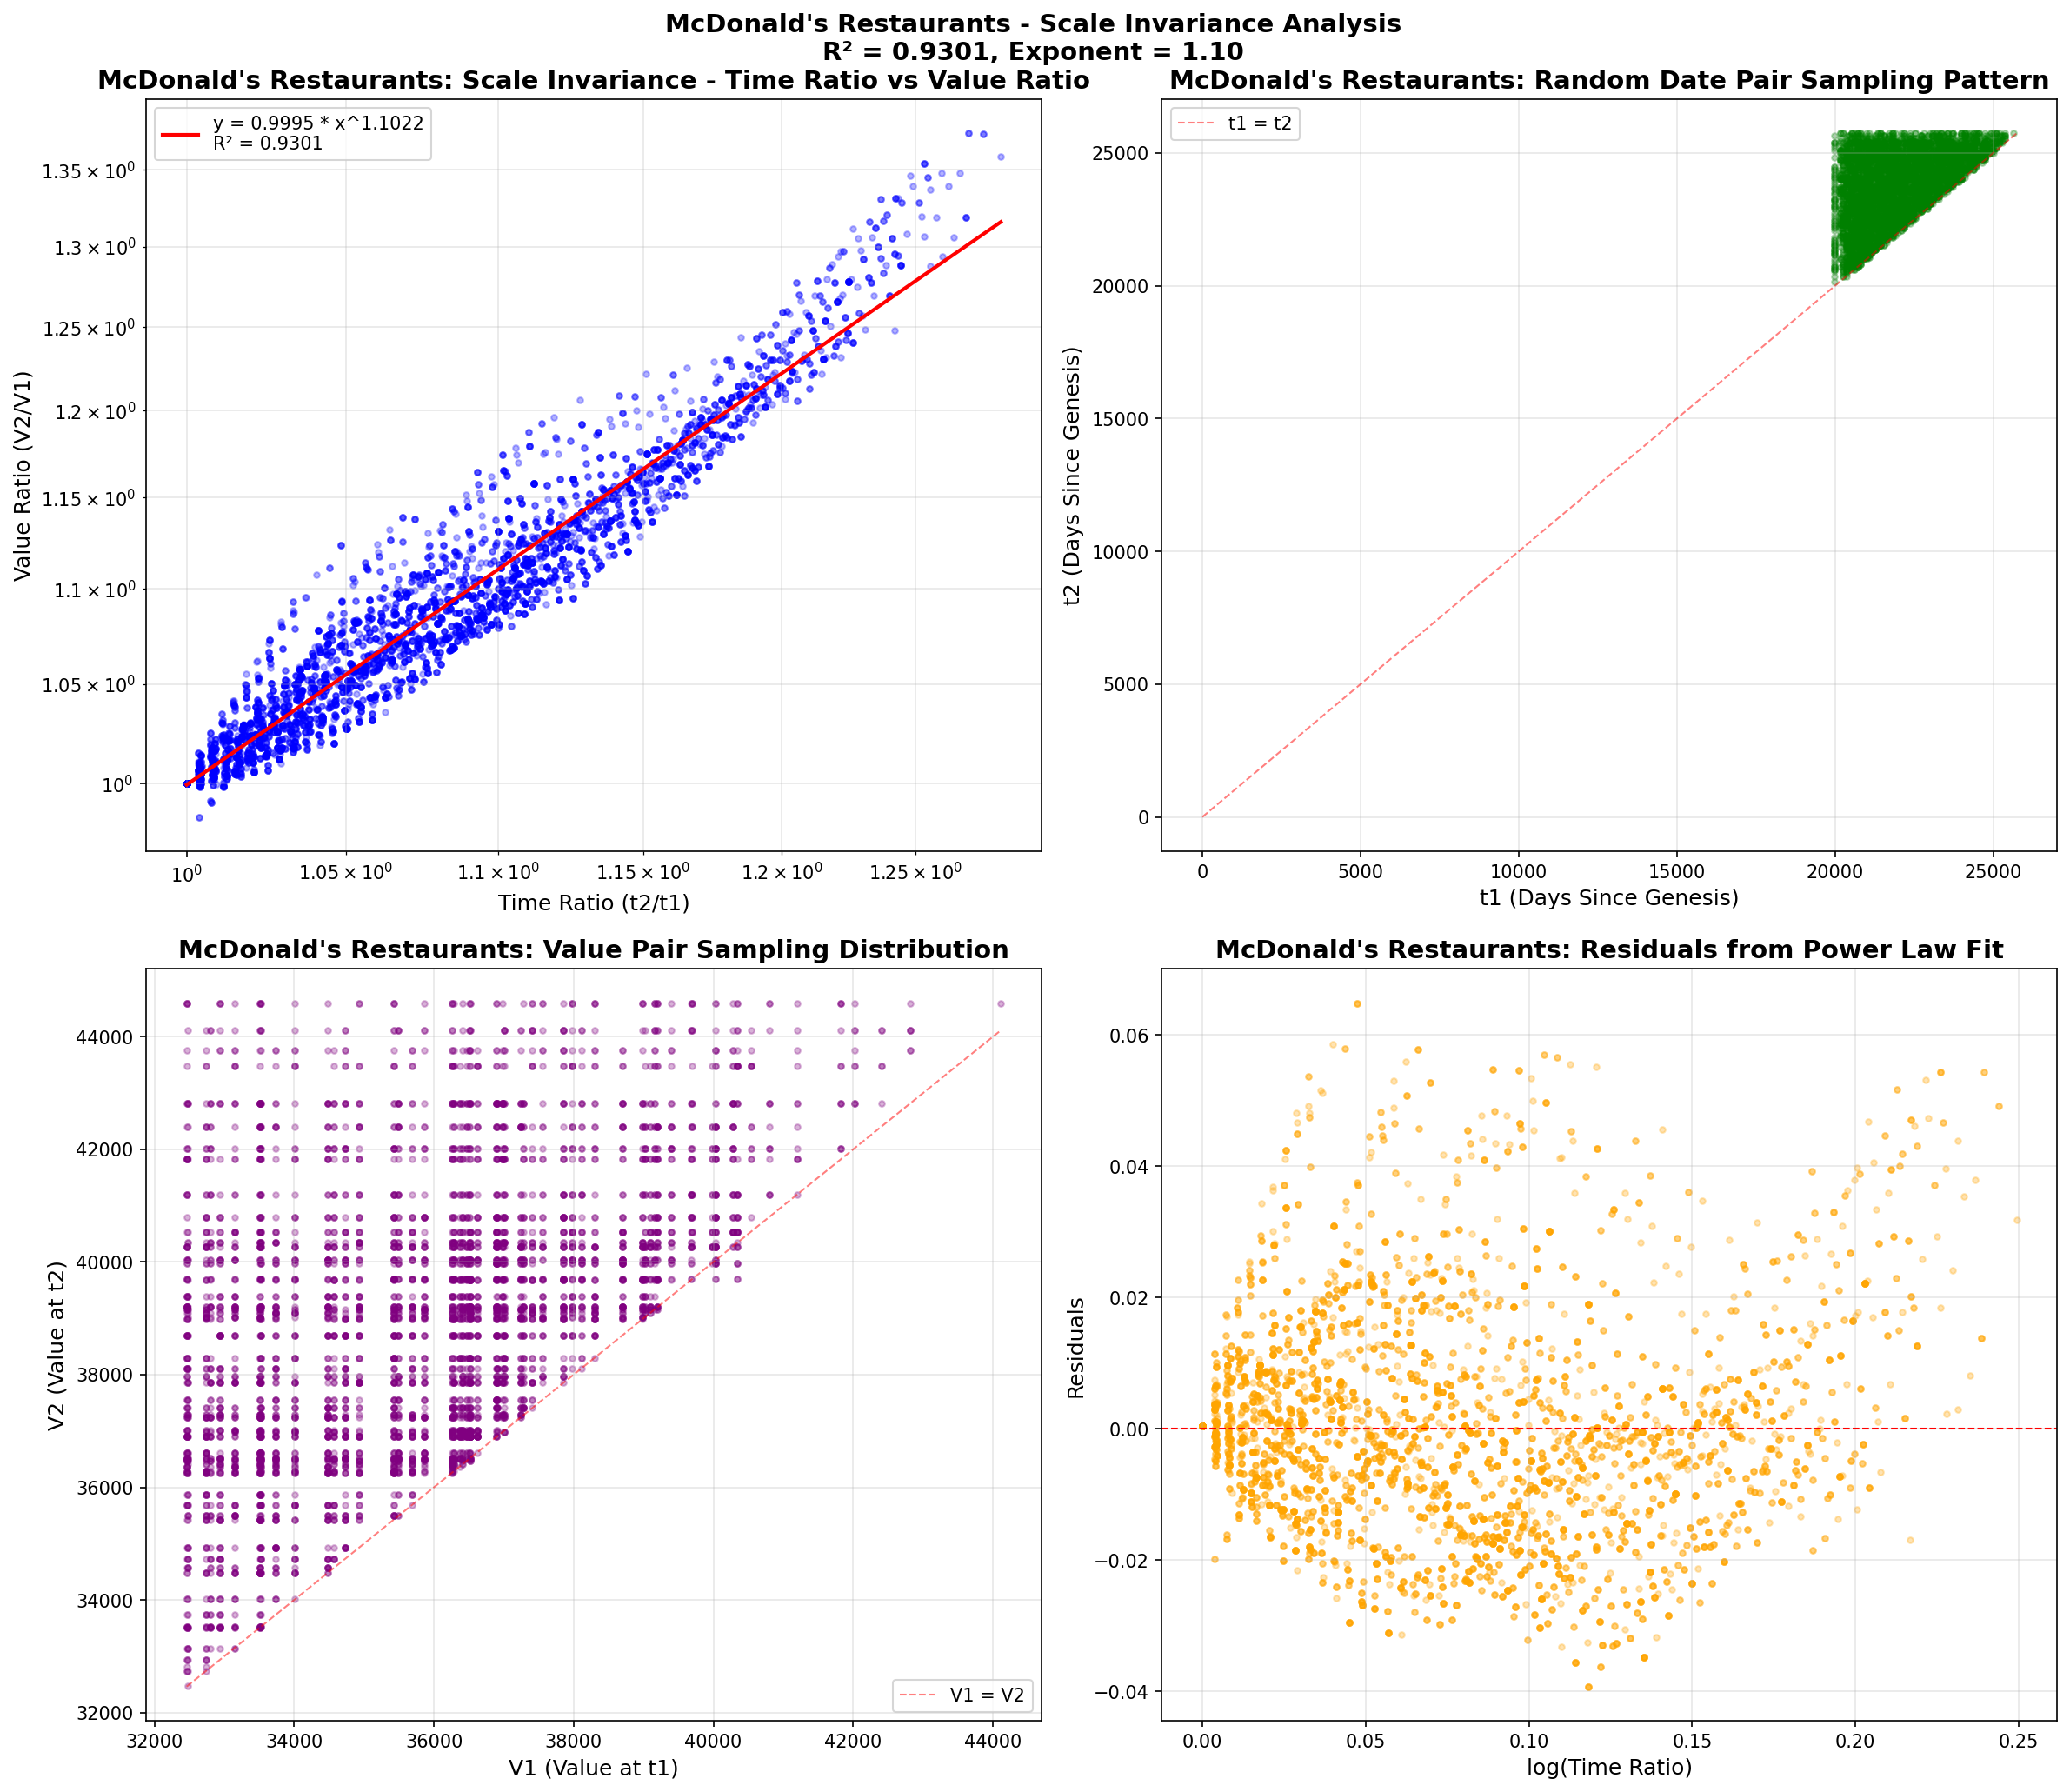
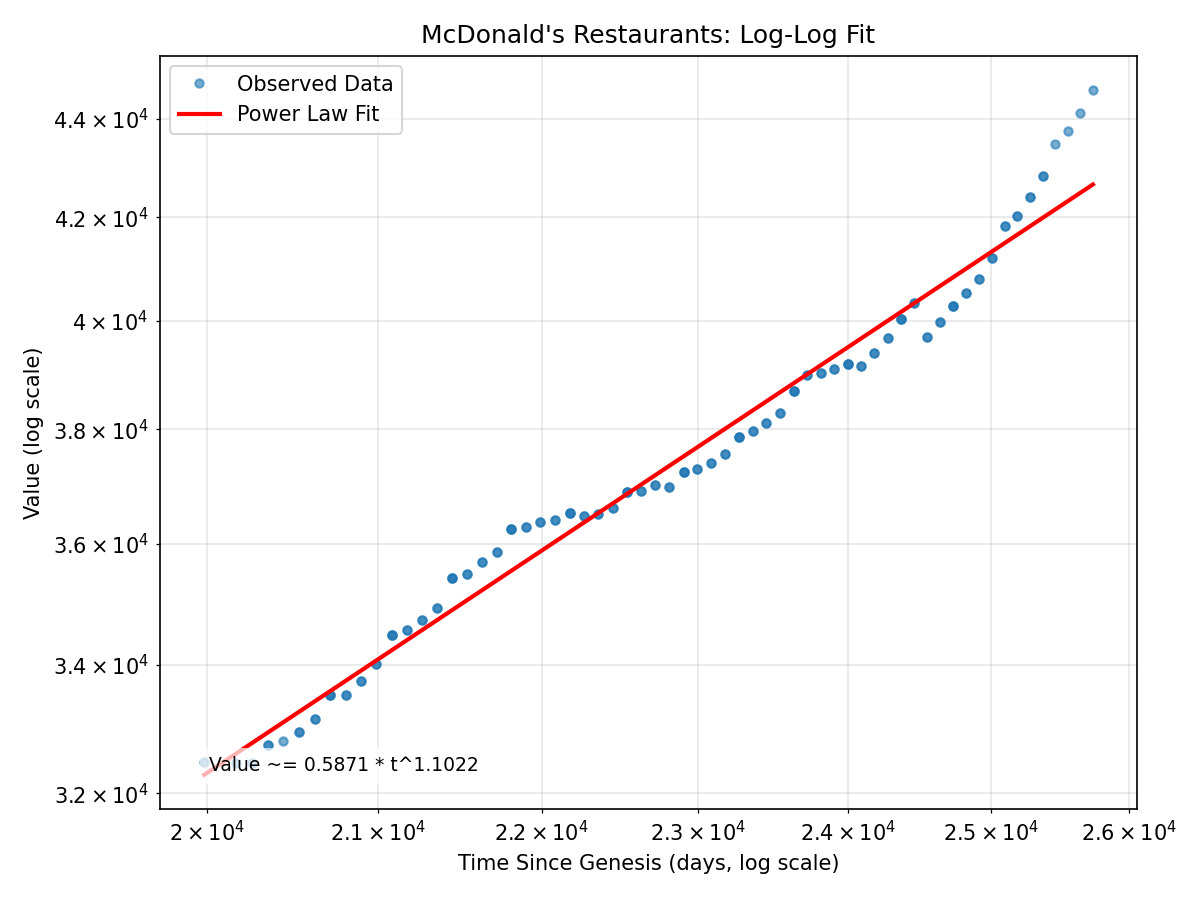
McDonald's Restaurants
**R² (Scale Invariance):** 0.9301
**Power Law Exponent:** 1.10
**Data Points:** 130
**Date Range:** 2009-12-31 to 2025-09-30
**Log Residual Std Dev:** 0.0117
**Data Source:** Downloaded from SEC EDGAR (CIK: 0000063908), us
**Genesis Date:** 1955-04-15 (Provided)
**Power Law Fit:** Value ~= 0.5871 * t^1.1022
Saturation Analysis (S-Curve Detection):
**⚡ POWER-LAW GROWTH** (Not saturating)
**Sigmoid R²:** 0.9767 vs Linear R²: 0.9729
**Current Value:** 0.0% of sigmoid model maximum
**Assessment:** No evidence of saturation or S-curve behavior
Financial Asset
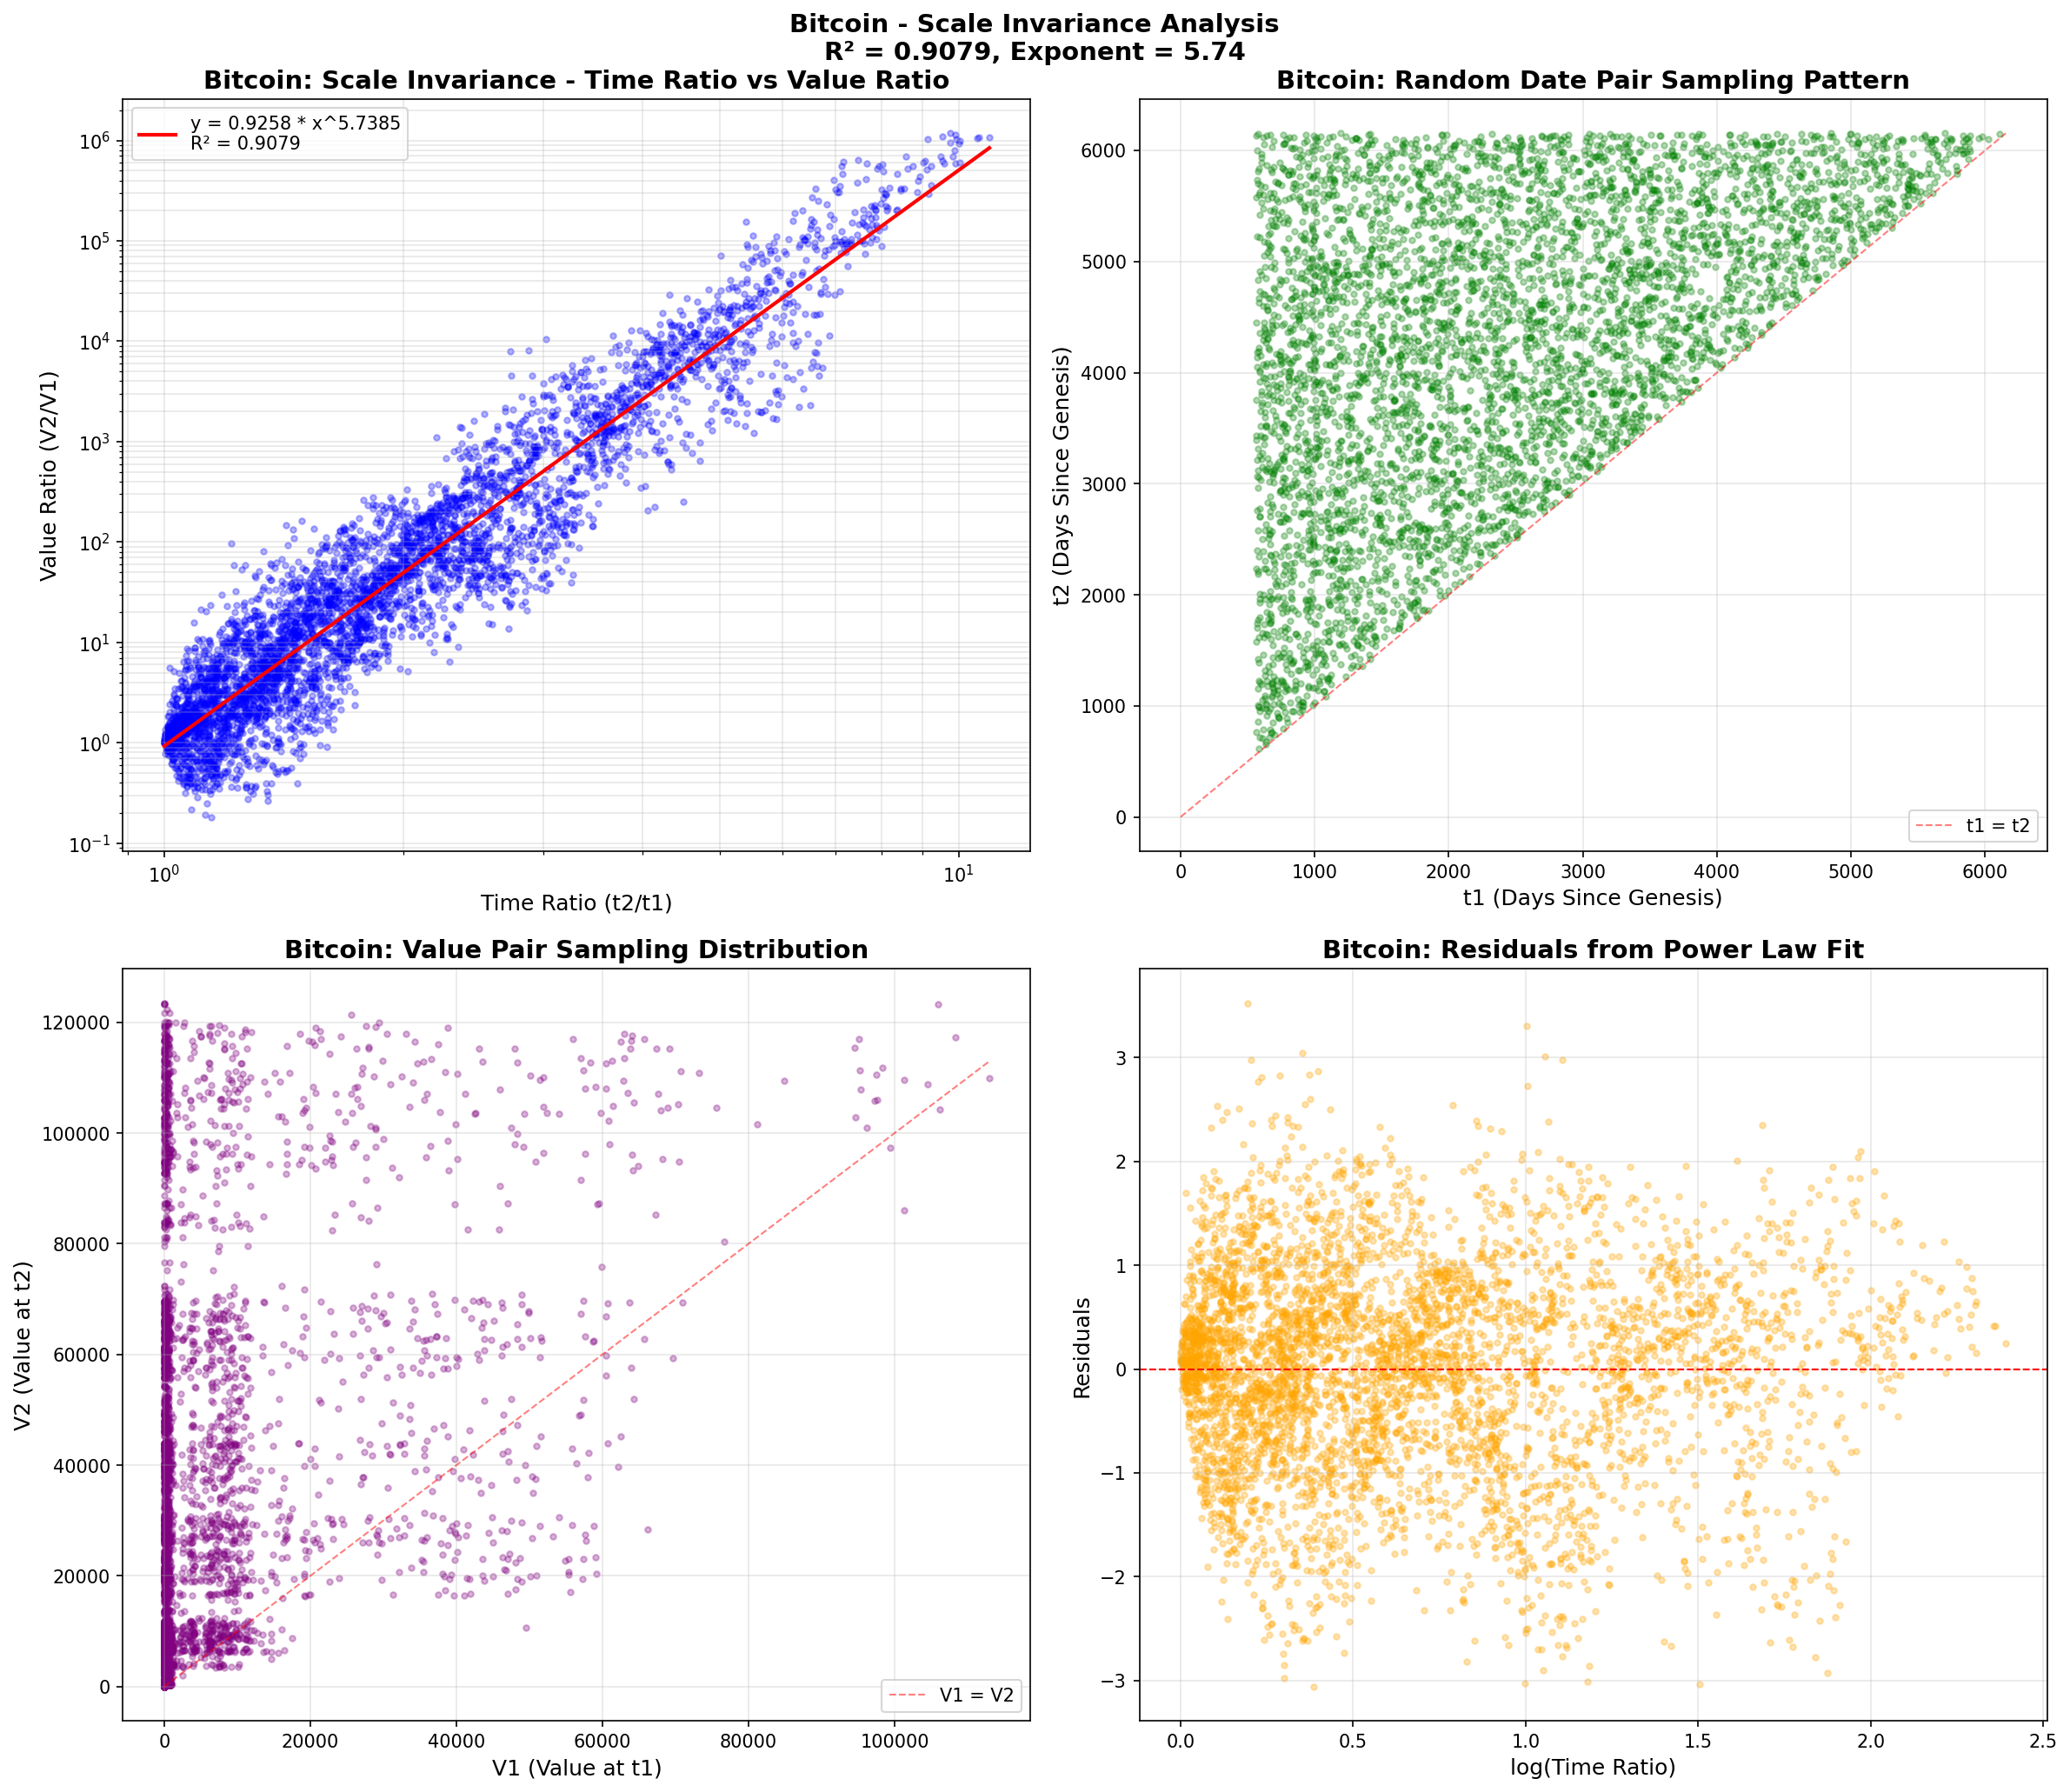
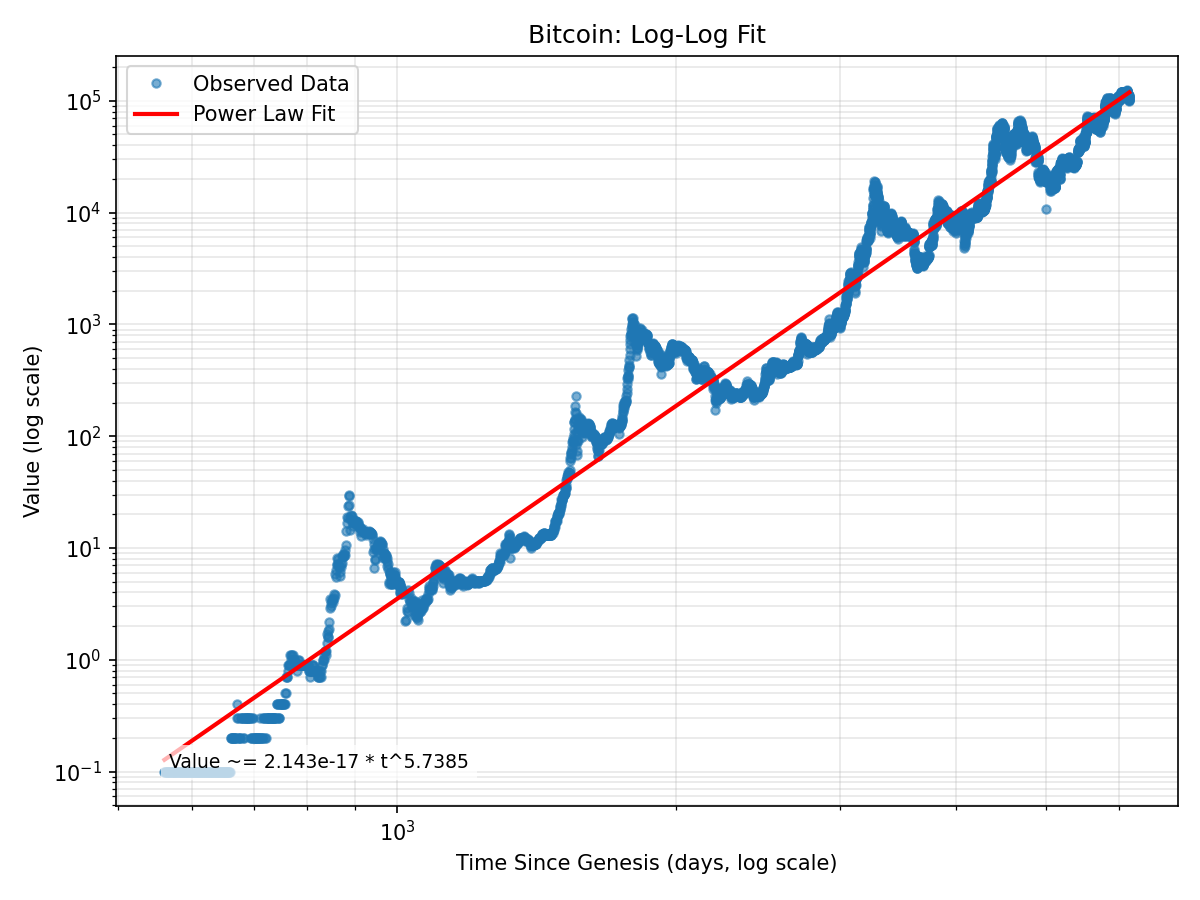
Bitcoin
**R² (Scale Invariance):** 0.9079
**Power Law Exponent:** 5.74
**Data Points:** 5,566
**Date Range:** 2010-07-18 to 2025-11-09
**Log Residual Std Dev:** 0.6935
**Data Source:** btcpricehistory.csv (repository data)
**Genesis Date:** 2009-01-03 (Provided)
**Power Law Fit:** Value ~= 2.143e-17 * t^5.7385
Saturation Analysis (S-Curve Detection):
**⚡ POWER-LAW GROWTH** (Not saturating)
**Sigmoid R²:** 0.8811 vs Linear R²: 0.6086
**Current Value:** 0.0% of sigmoid model maximum
**Assessment:** No evidence of saturation or S-curve behavior
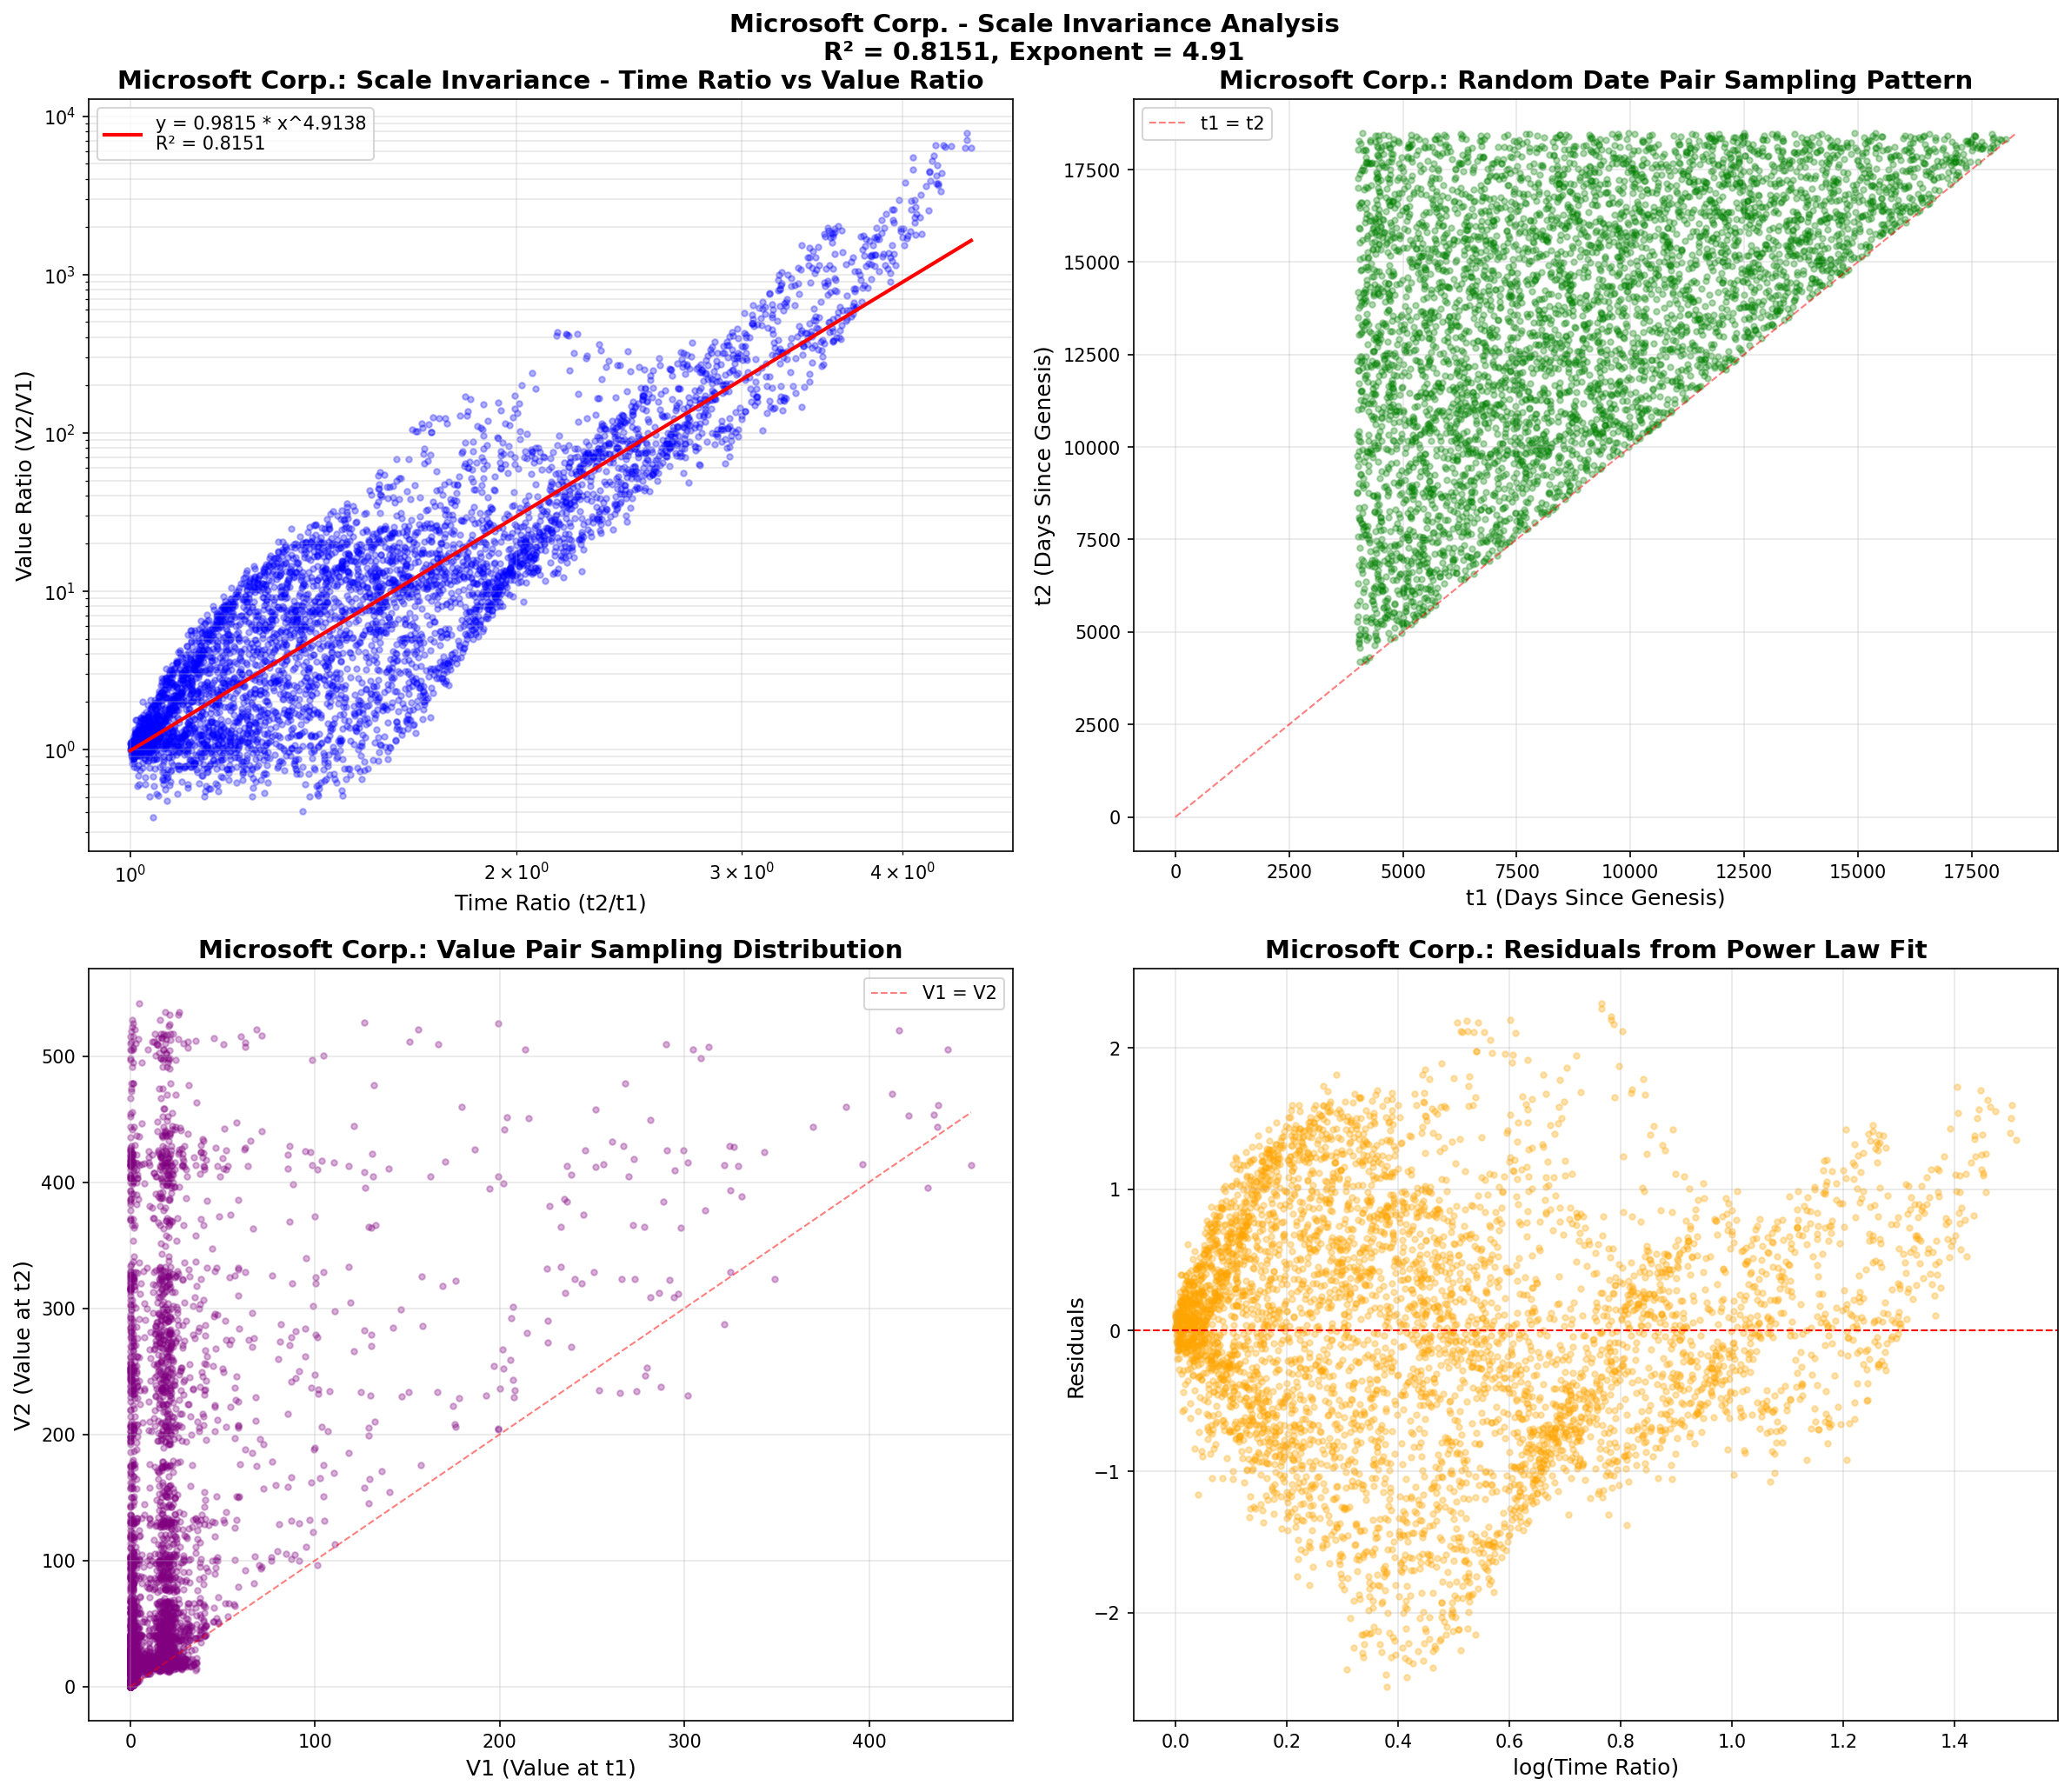
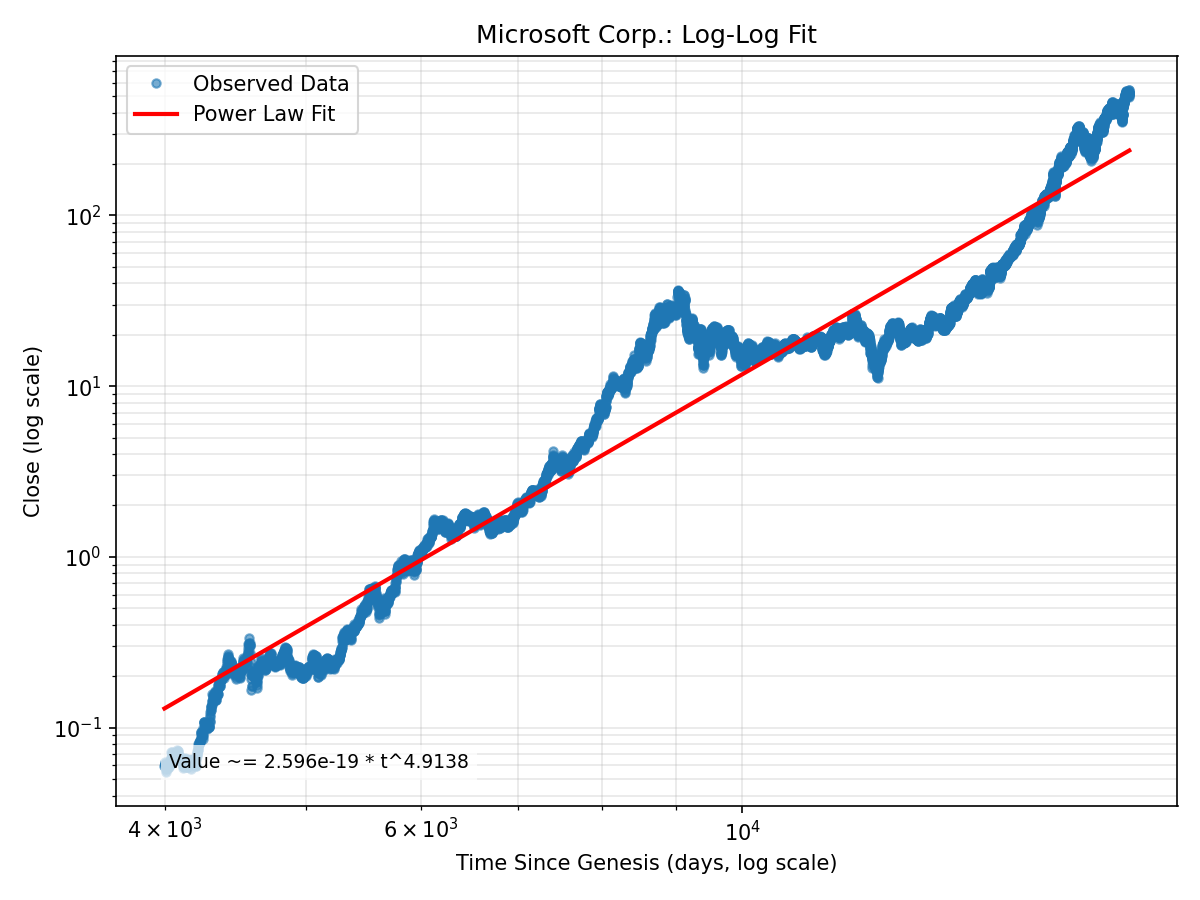
Microsoft Corp.
**R² (Scale Invariance):** 0.8151
**Power Law Exponent:** 4.91
**Data Points:** 9,993
**Date Range:** 1986-03-13 to 2025-11-07
**Log Residual Std Dev:** 0.5848
**Data Source:** Yahoo Finance API (yfinance Python library)
**Genesis Date:** 1975-04-04 (Provided)
**Power Law Fit:** Value ~= 2.596e-19 * t^4.9138
Saturation Analysis (S-Curve Detection):
**⚡ POWER-LAW GROWTH** (Not saturating)
**Sigmoid R²:** 0.9792 vs Linear R²: 0.5089
**Current Value:** 67.9% of sigmoid model maximum
**Assessment:** No evidence of saturation or S-curve behavior
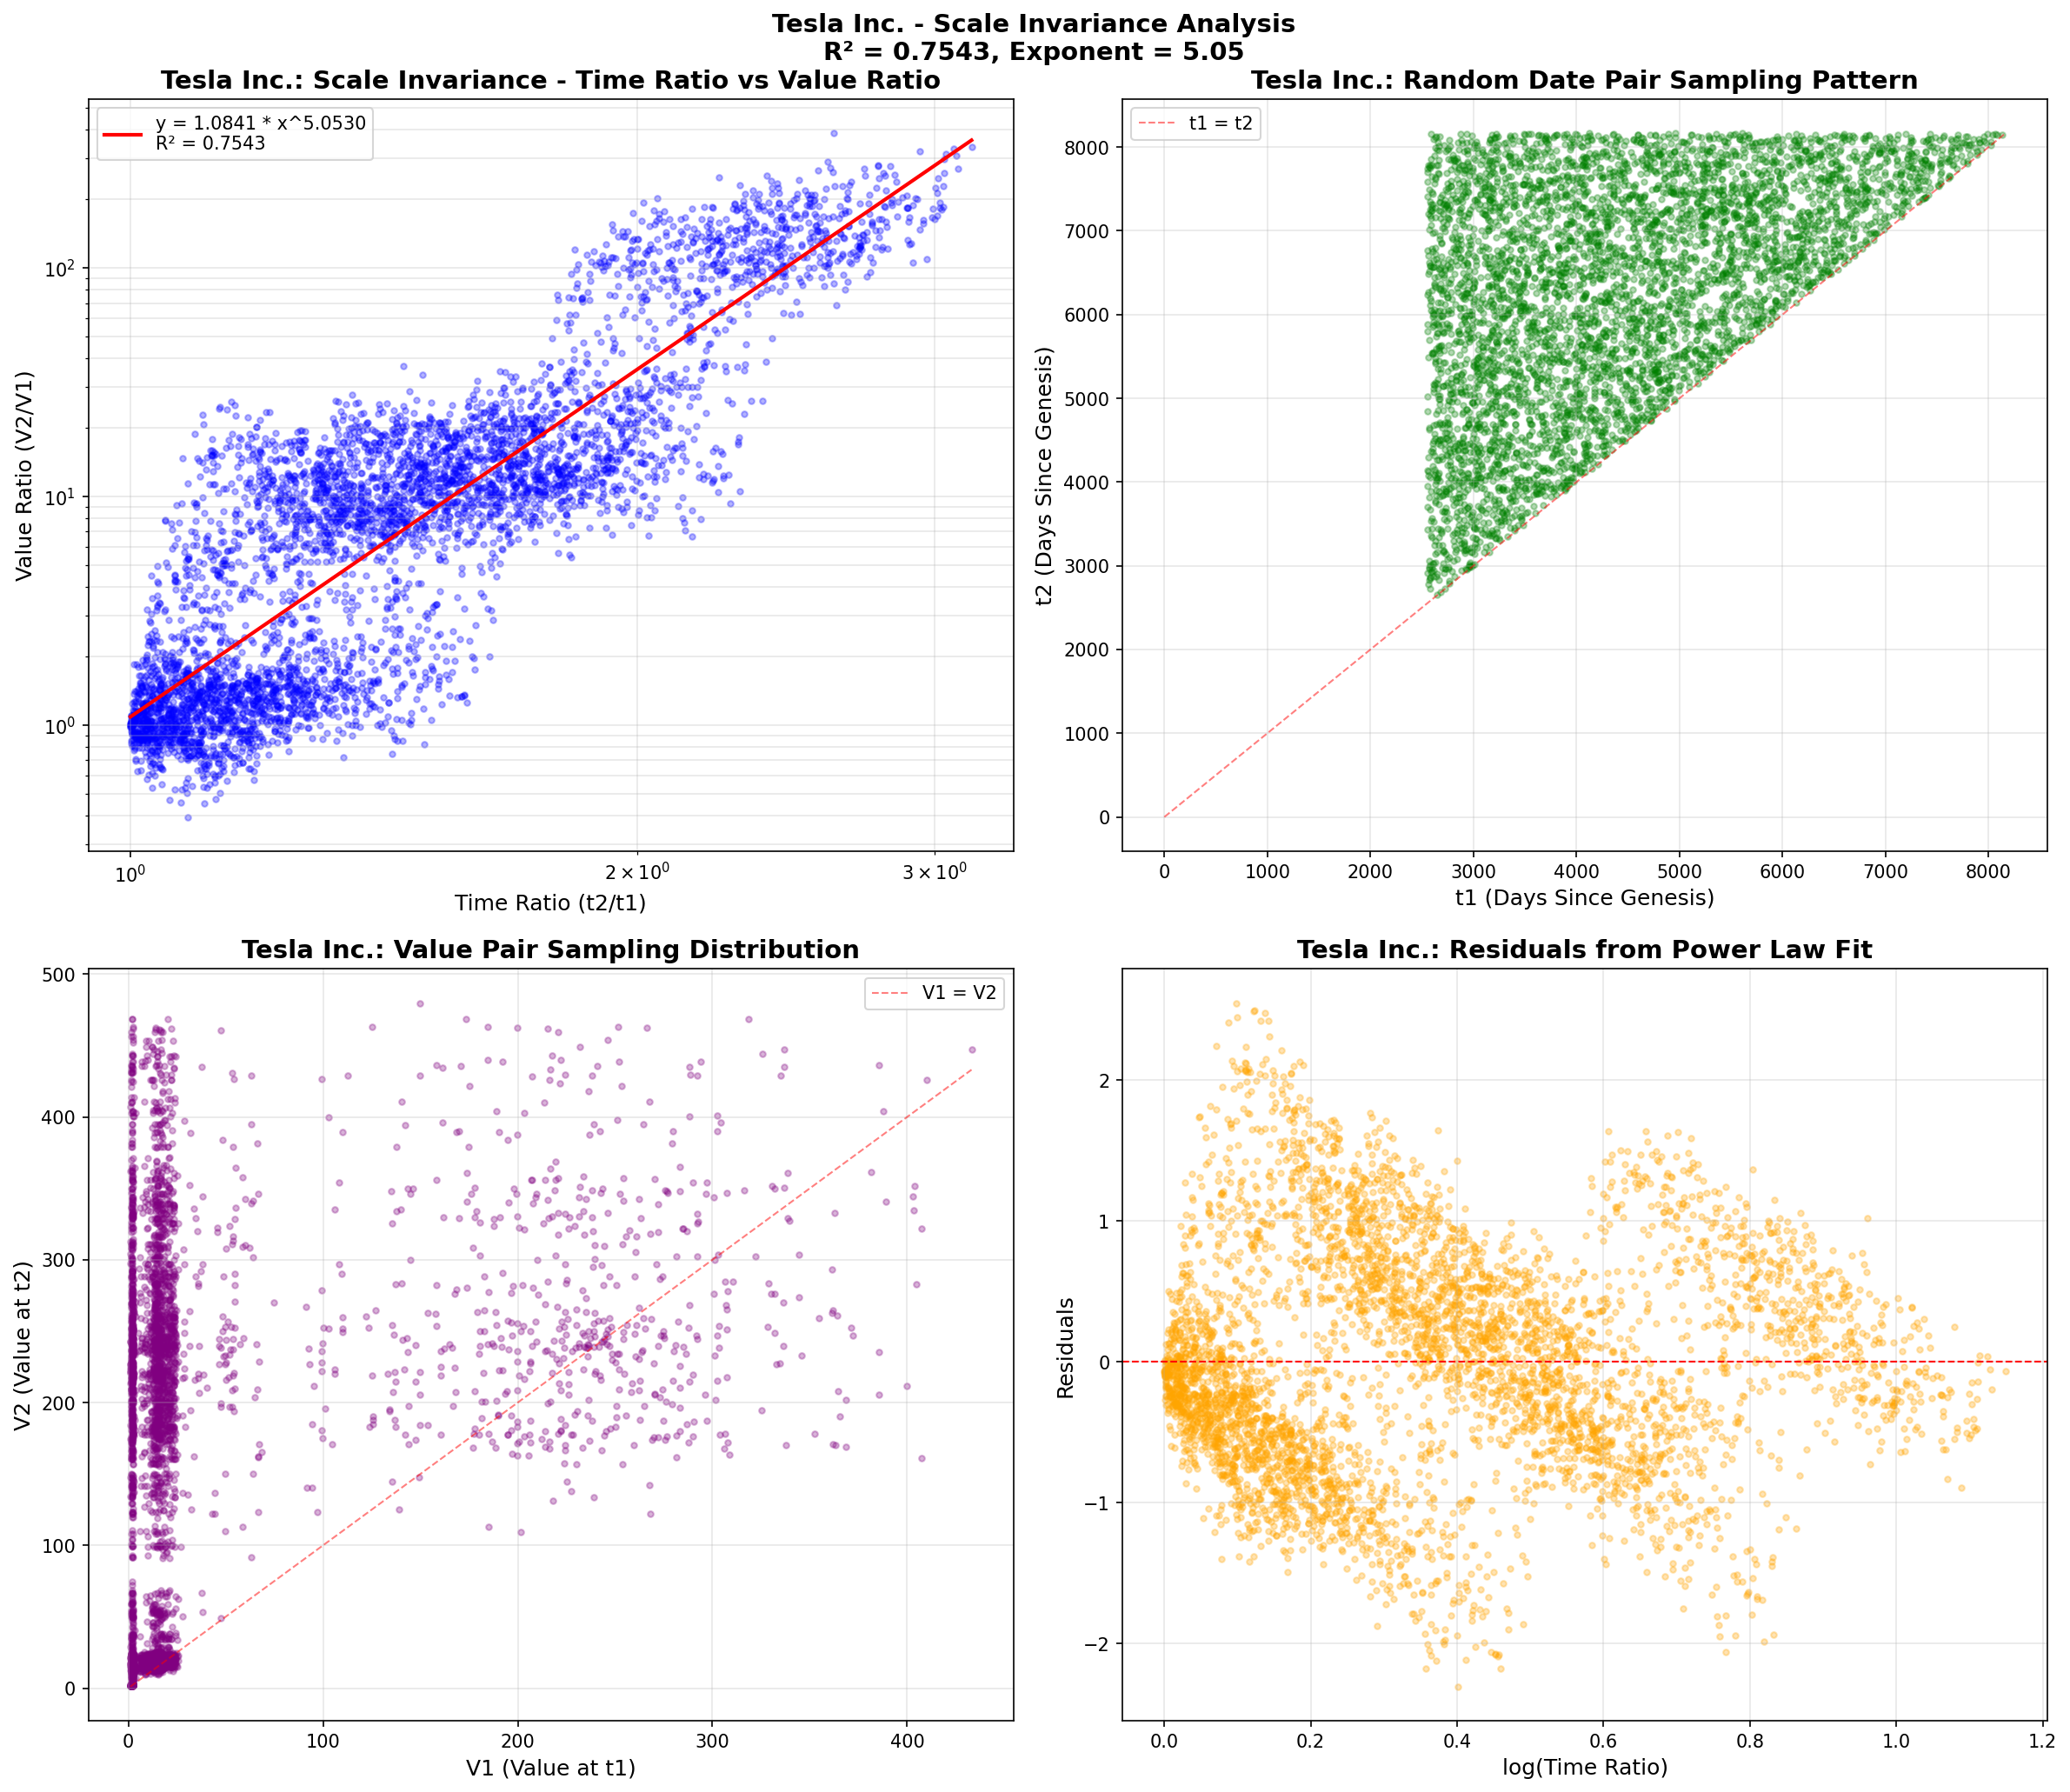
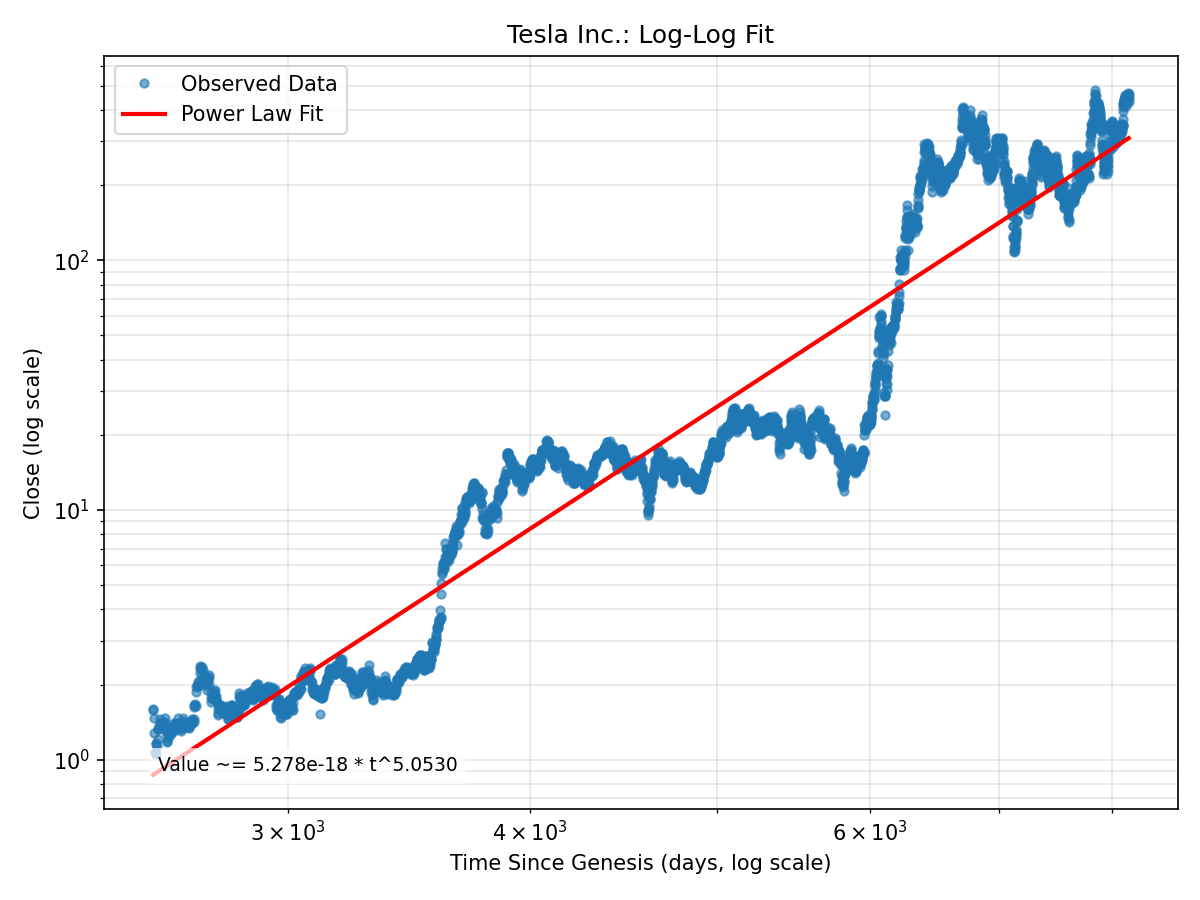
Tesla Inc.
**R² (Scale Invariance):** 0.7543
**Power Law Exponent:** 5.05
**Data Points:** 3,866
**Date Range:** 2010-06-29 to 2025-11-07
**Log Residual Std Dev:** 0.5591
**Data Source:** Yahoo Finance API (yfinance Python library)
**Genesis Date:** 2003-07-01 (Provided)
**Power Law Fit:** Value ~= 5.278e-18 * t^5.0530
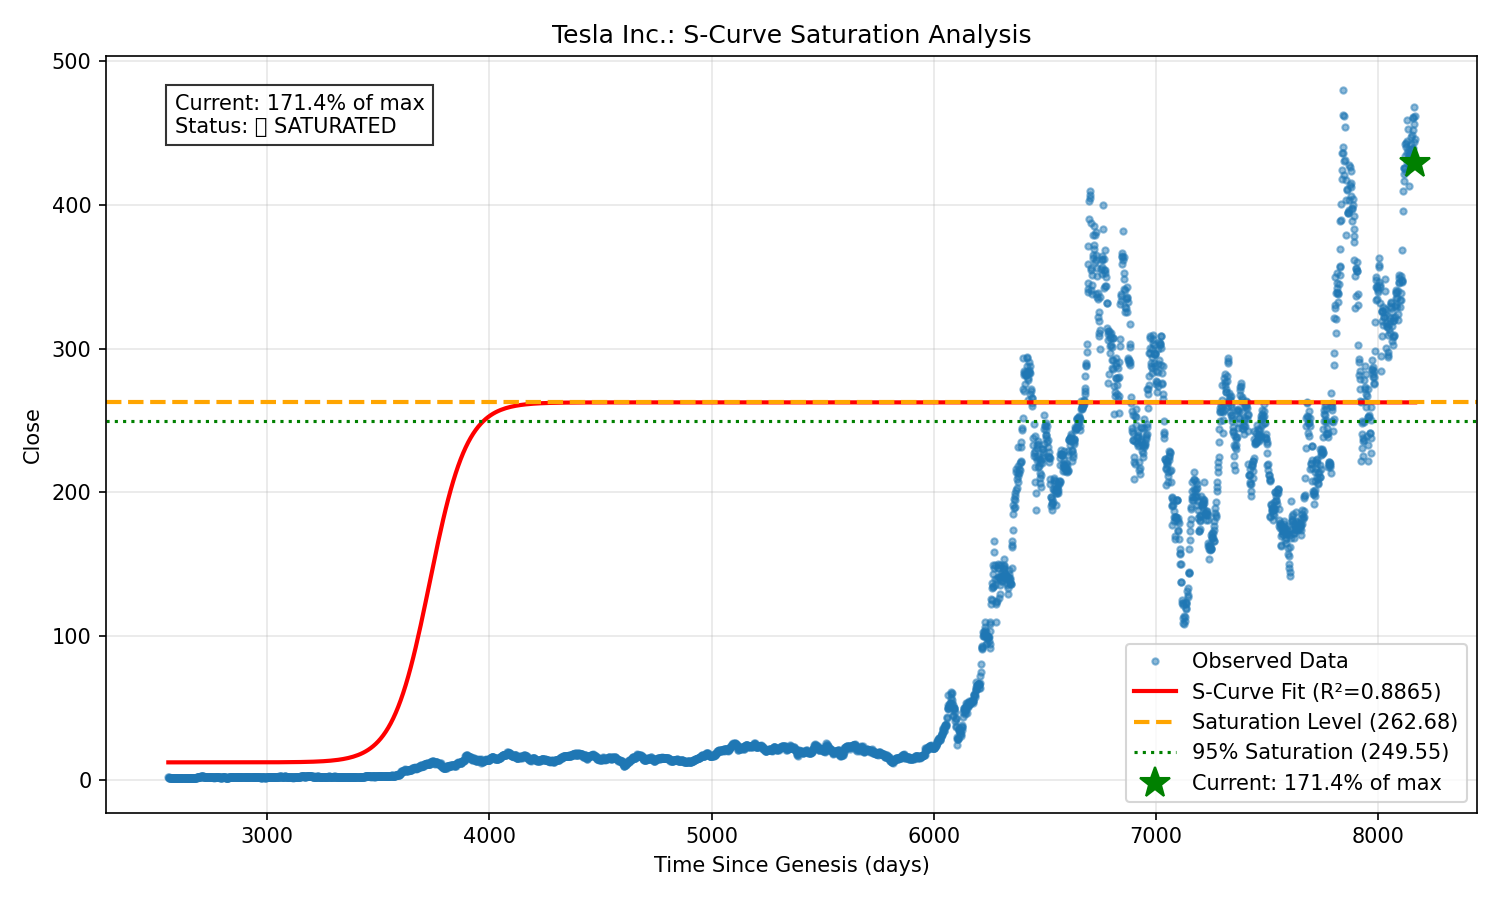
Saturation Analysis (S-Curve Detection):
**📈 S-CURVE DETECTED** (Sigmoid R² = 0.8865 vs Linear R² = 0.6847)
**Current Progress:** 171.4% of estimated maximum
**Saturation Level:** 2.51e+02 (estimated carrying capacity)
**✅ HAS REACHED SATURATION** (≥95% of maximum)
**Growth Pattern:** Decelerating (-244.1% slowdown in recent period)
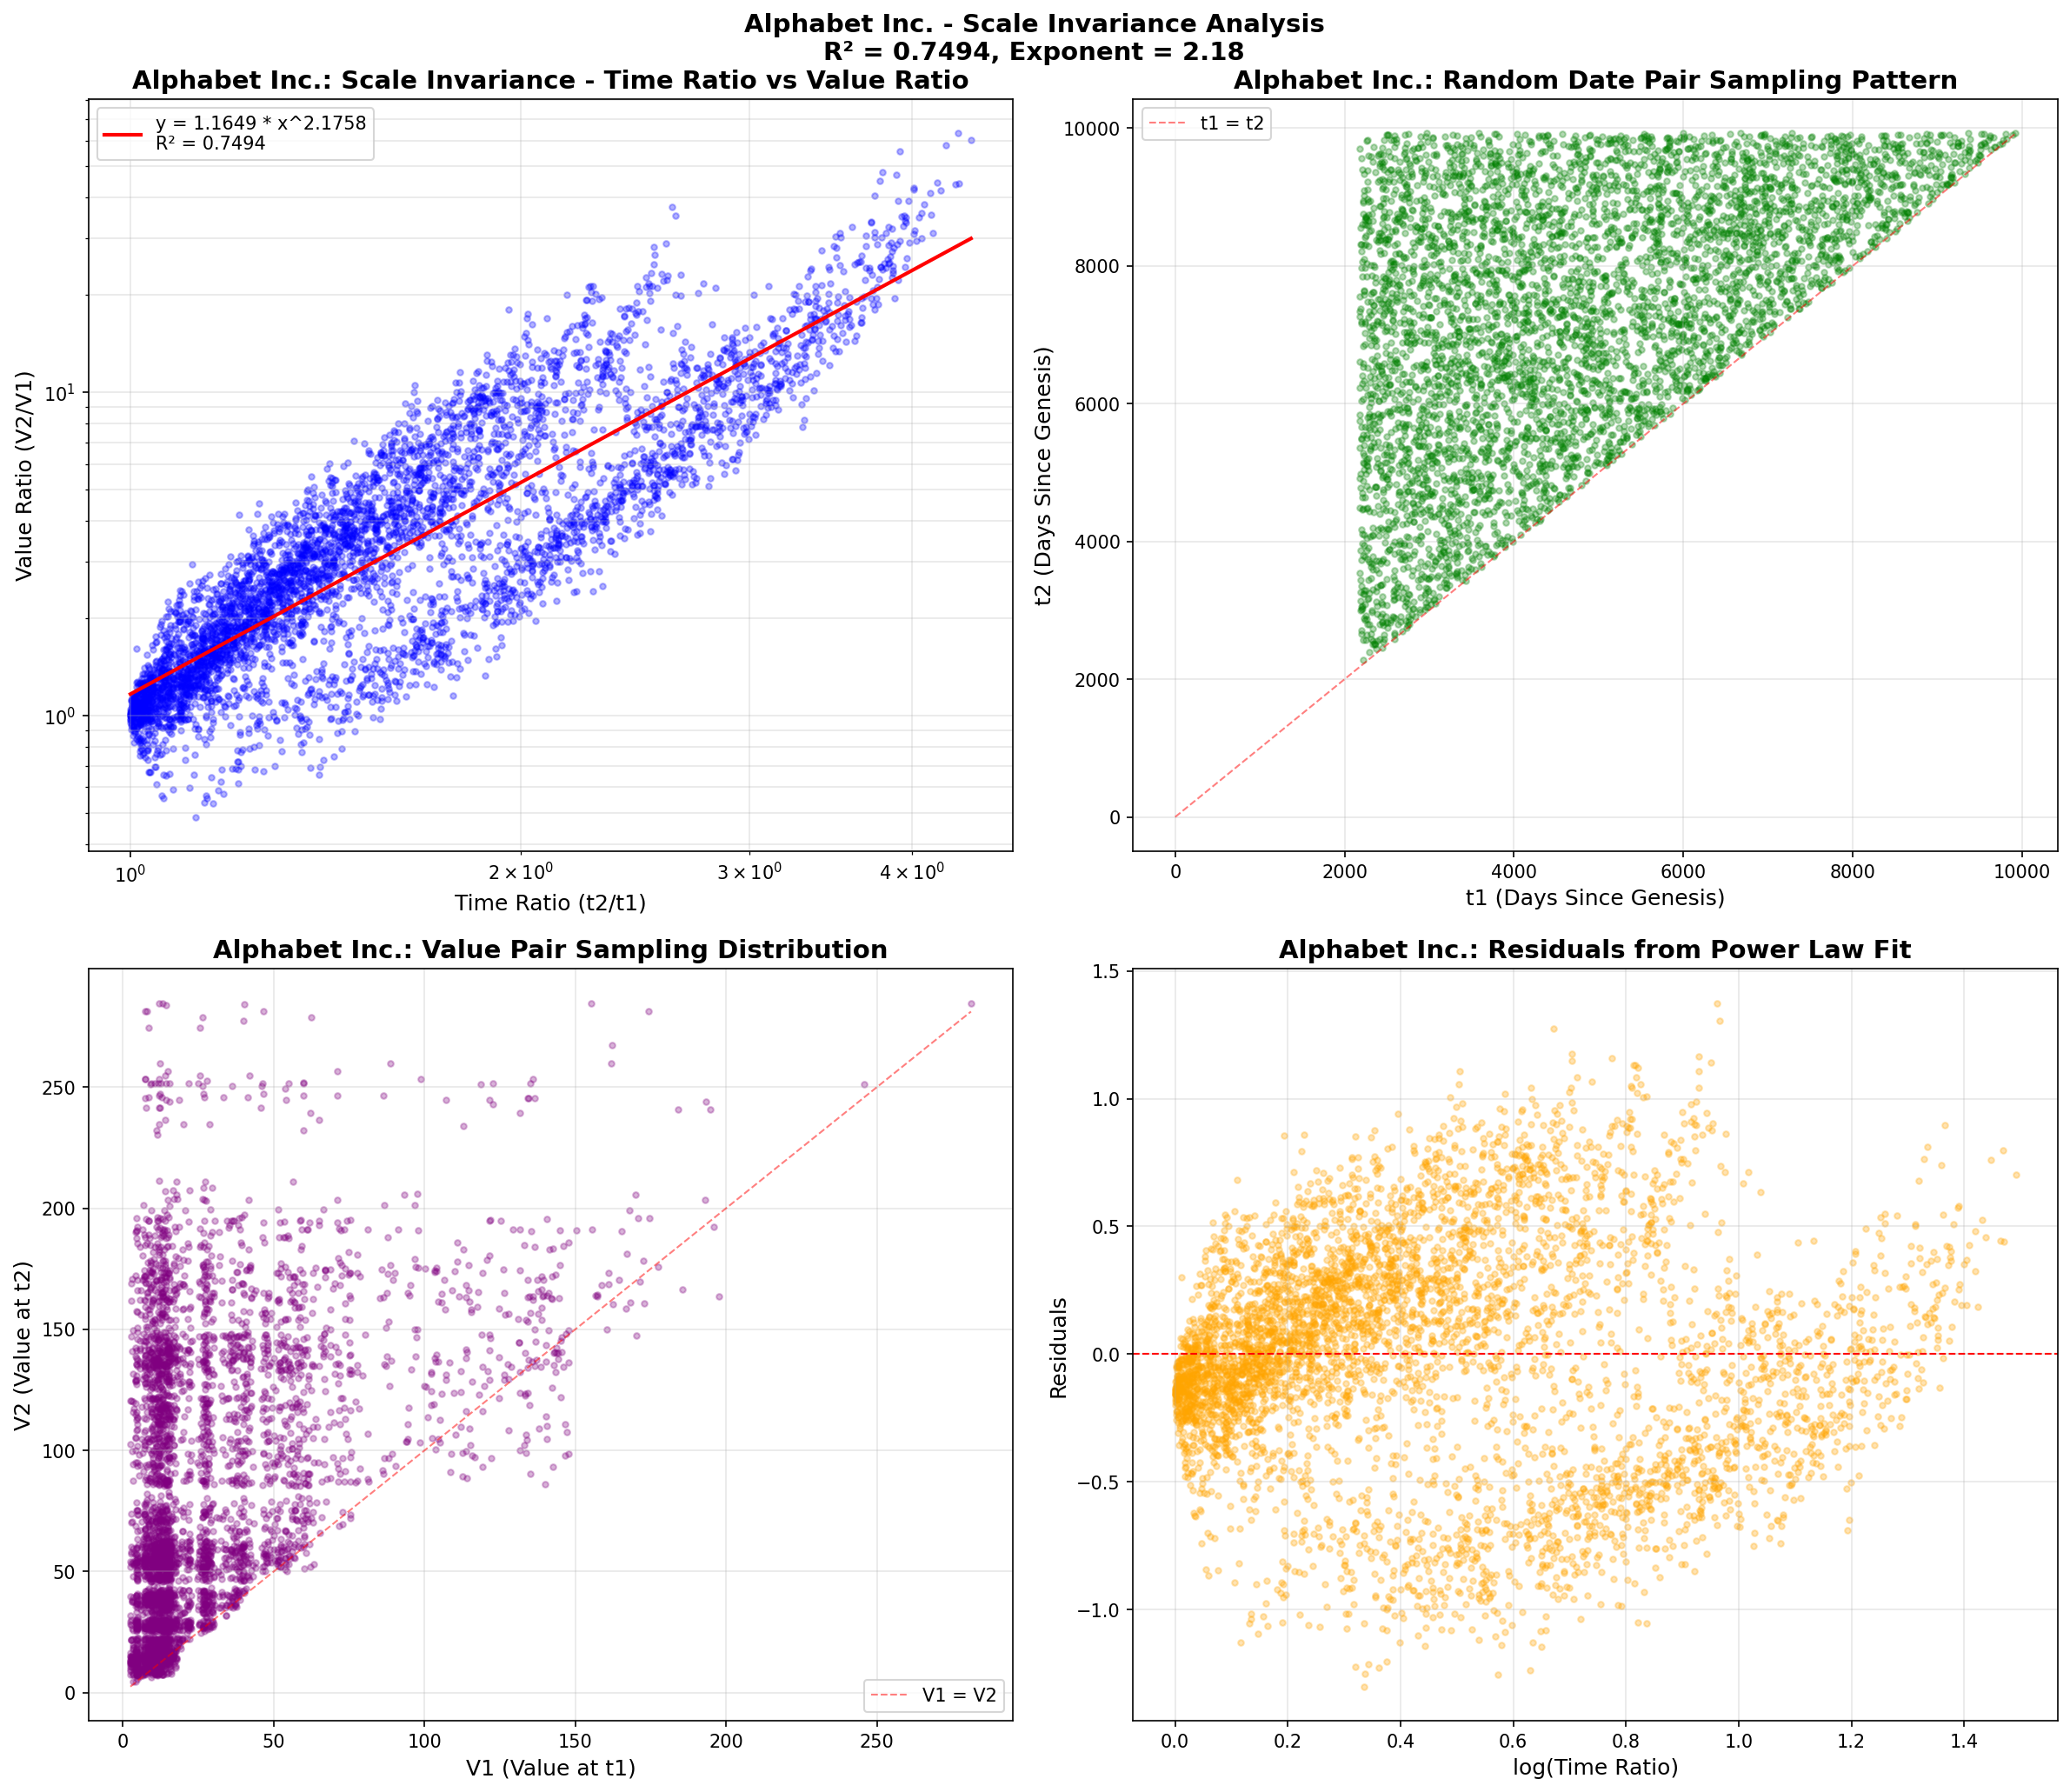
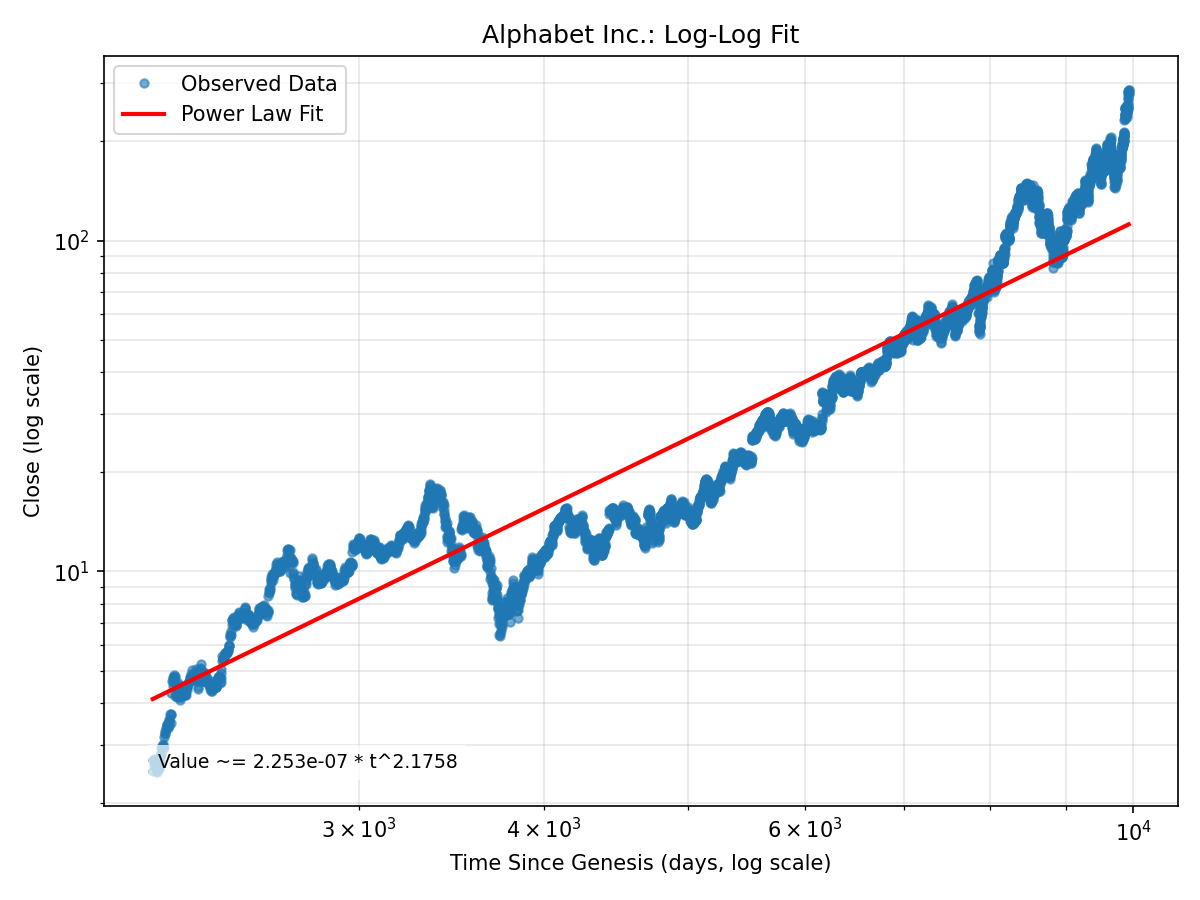
Alphabet Inc.
**R² (Scale Invariance):** 0.7494
**Power Law Exponent:** 2.18
**Data Points:** 5,341
**Date Range:** 2004-08-19 to 2025-11-07
**Log Residual Std Dev:** 0.3312
**Data Source:** Yahoo Finance API (yfinance Python library)
**Genesis Date:** 1998-09-04 (Provided)
**Power Law Fit:** Value ~= 2.253e-07 * t^2.1758
Saturation Analysis (S-Curve Detection):
**⚡ POWER-LAW GROWTH** (Not saturating)
**Sigmoid R²:** 0.9511 vs Linear R²: 0.7689
**Current Value:** 0.0% of sigmoid model maximum
**Assessment:** No evidence of saturation or S-curve behavior
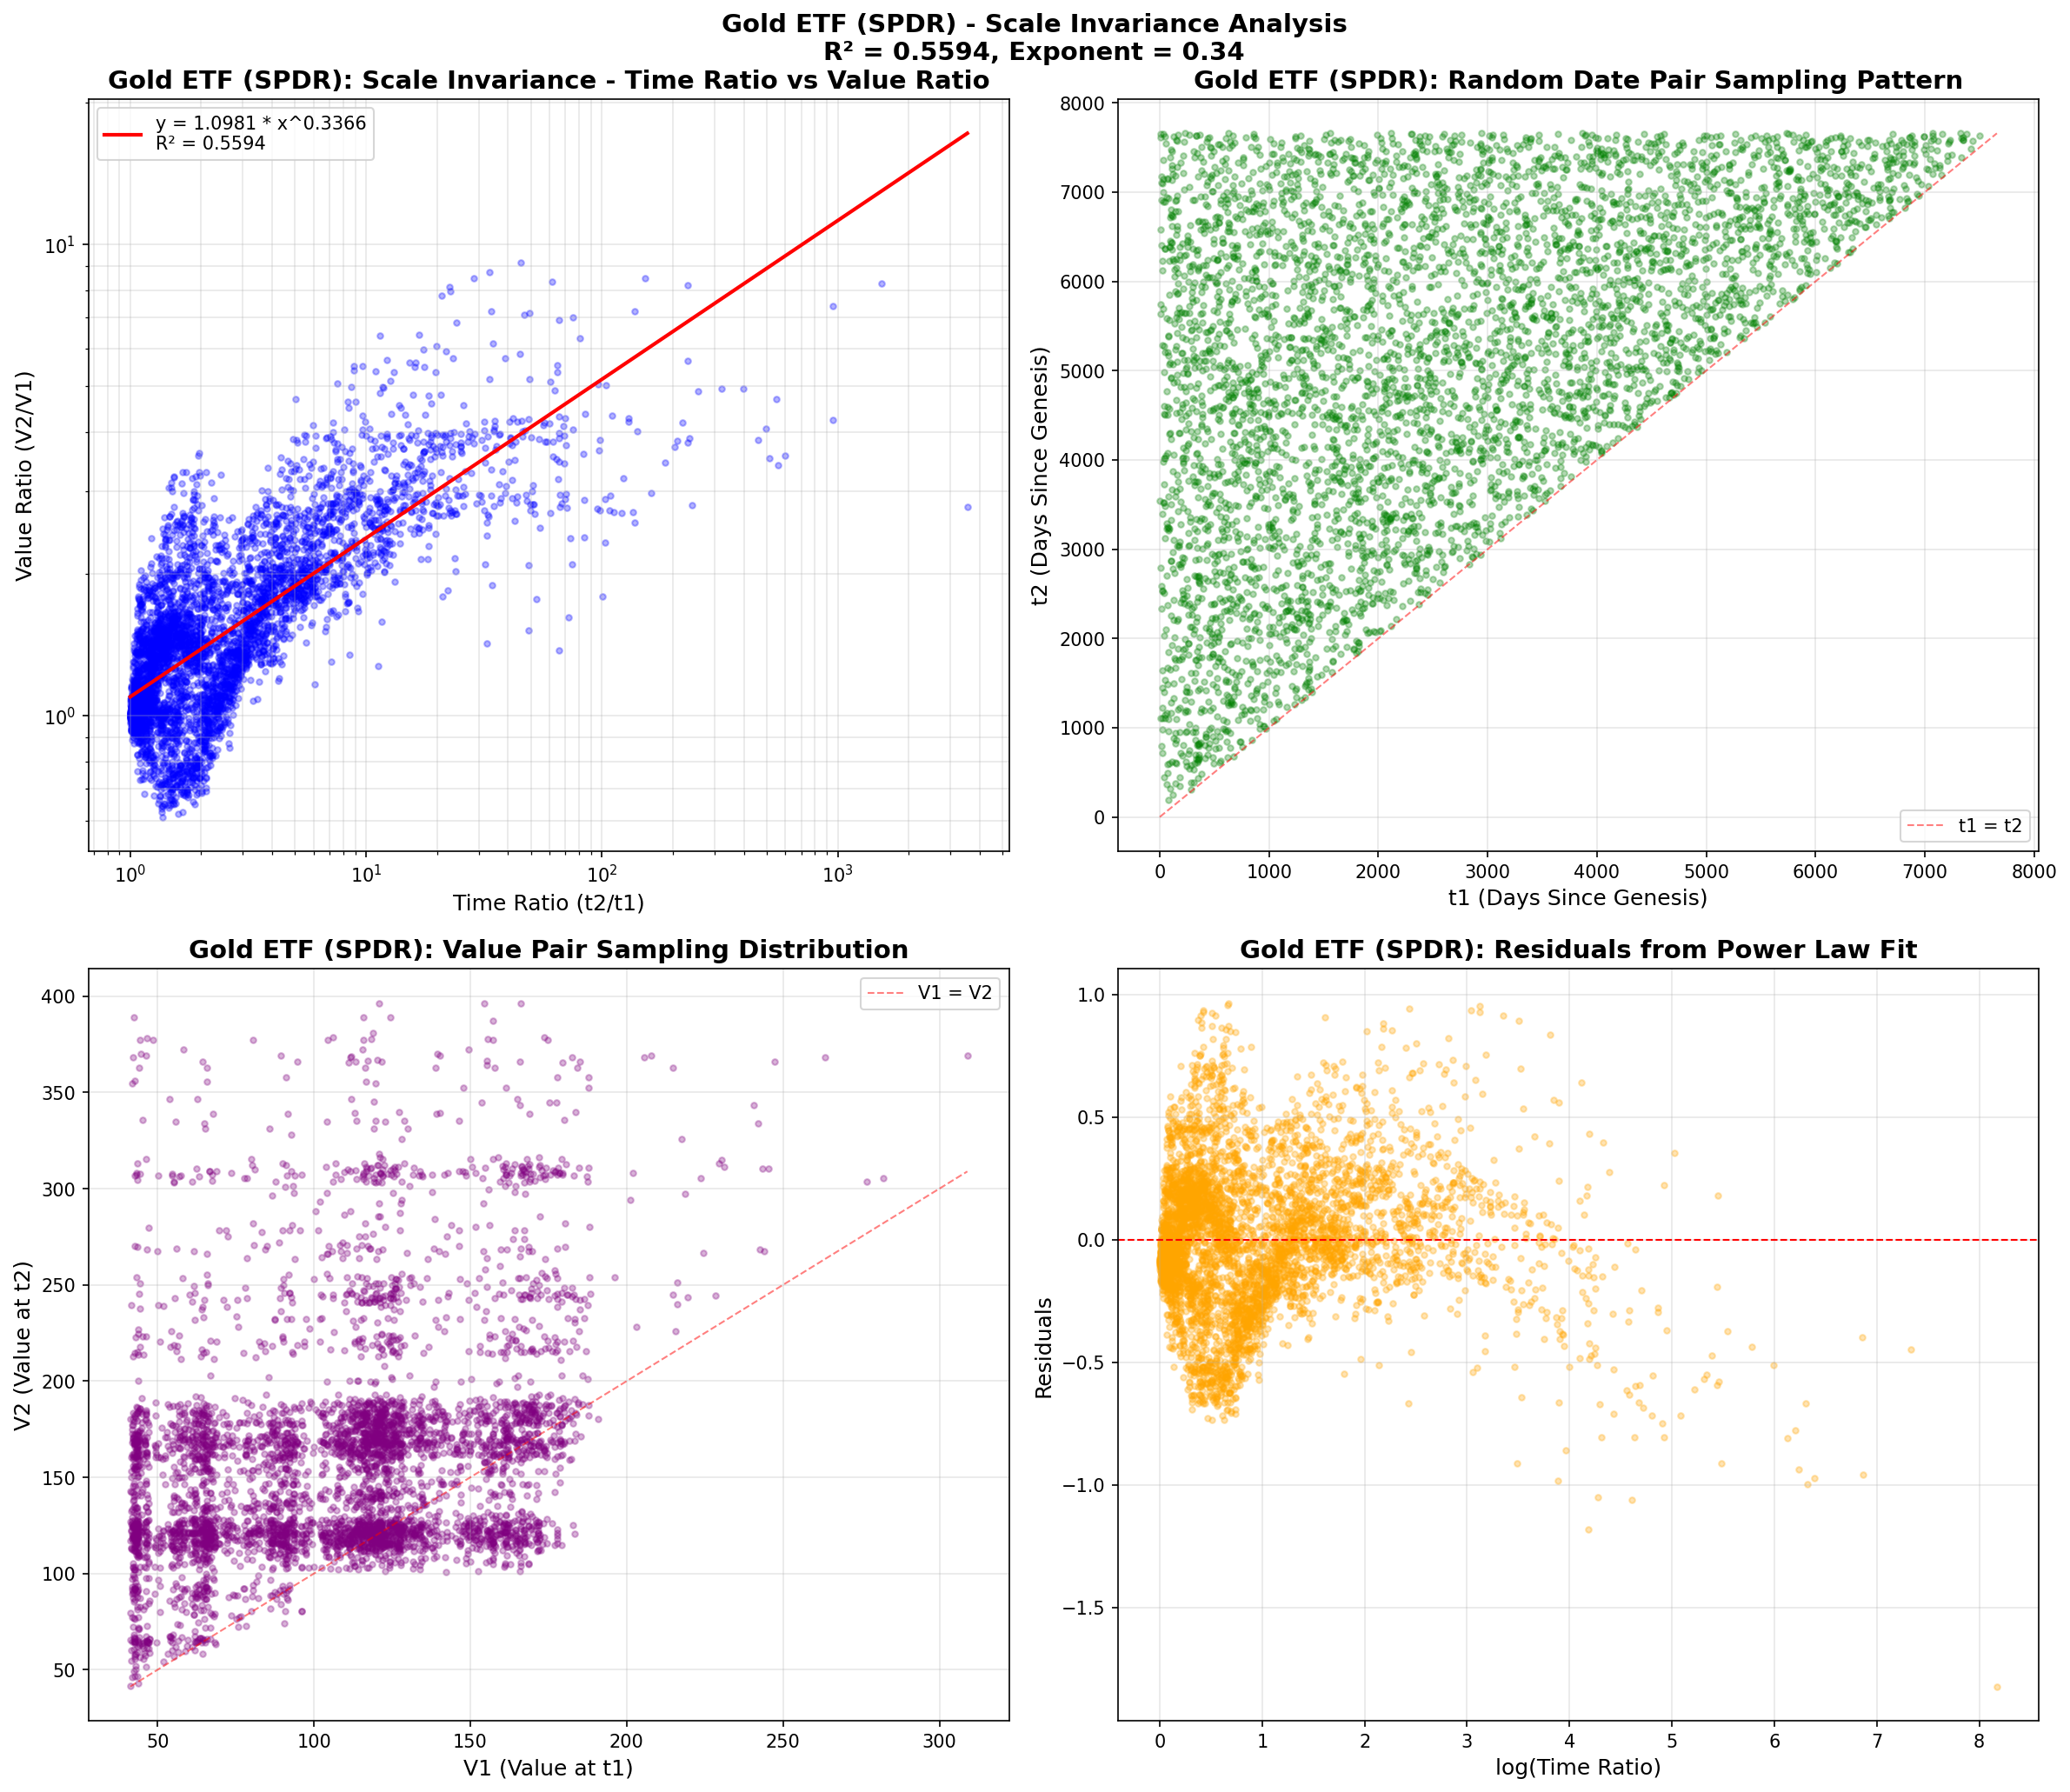
Gold ETF (SPDR)
**R² (Scale Invariance):** 0.5594
**Power Law Exponent:** 0.34
**Data Points:** 5,277
**Date Range:** 2004-11-18 to 2025-11-07
**Log Residual Std Dev:** 0.2191
**Data Source:** Yahoo Finance API (yfinance Python library)
**Genesis Date:** 2004-11-18 (Provided)
**Power Law Fit:** Value ~= 8.49 * t^0.3366
Saturation Analysis (S-Curve Detection):
**⚡ POWER-LAW GROWTH** (Not saturating)
**Sigmoid R²:** 0.7333 vs Linear R²: 0.6669
**Current Value:** 0.0% of sigmoid model maximum
**Assessment:** No evidence of saturation or S-curve behavior
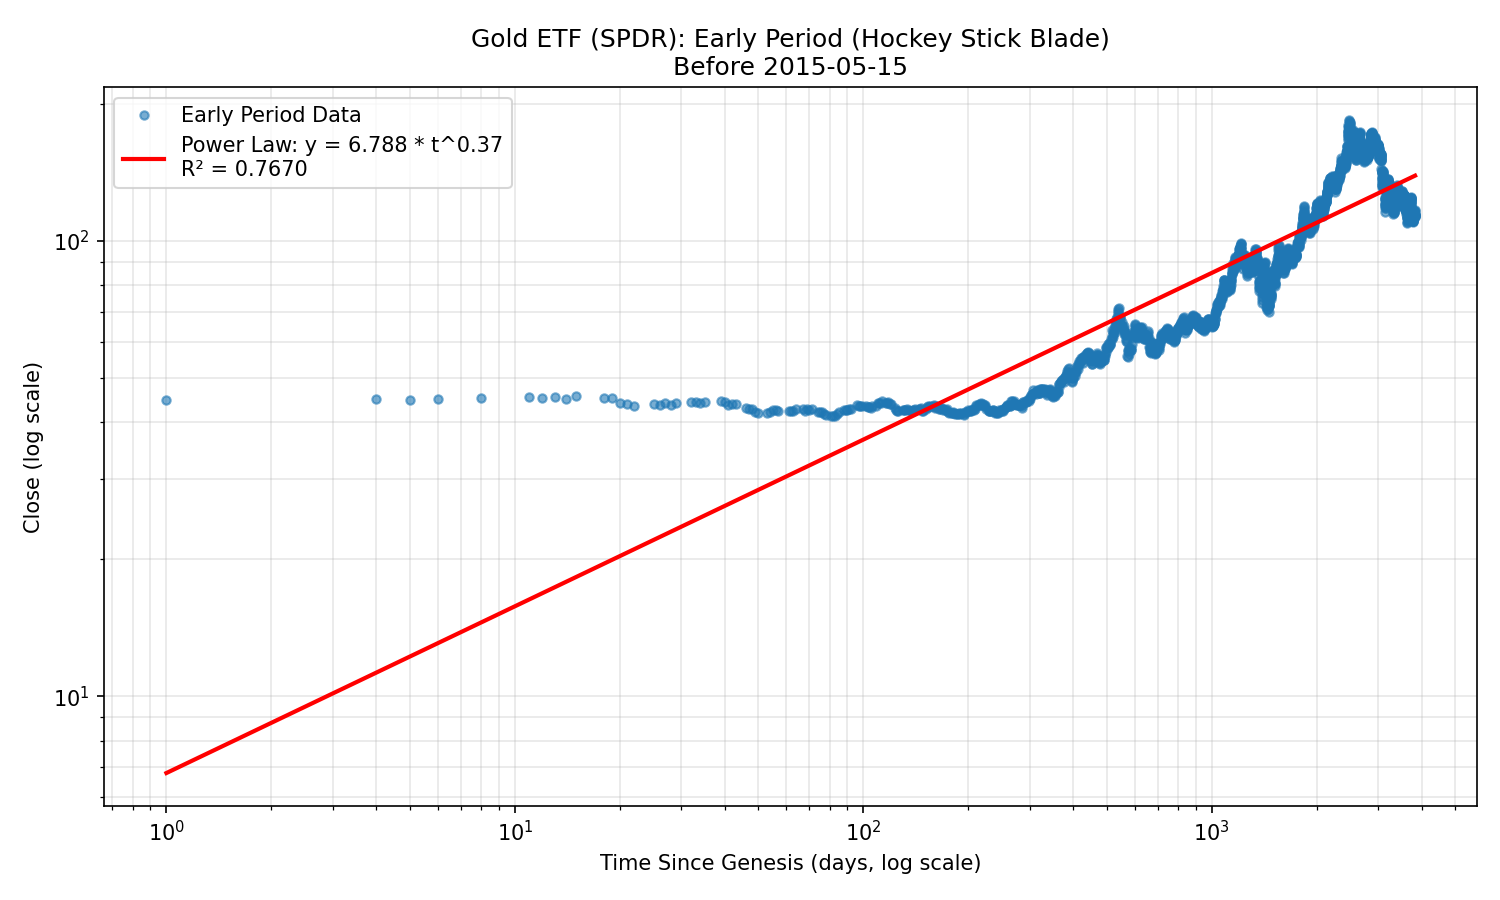
Hockey Stick Pattern Detected:
**🏒 INFLECTION POINT:** 2015-05-15
**Early Period (Blade):**
- R² = 0.7670
- Exponent = 0.37
- Data points = 2638
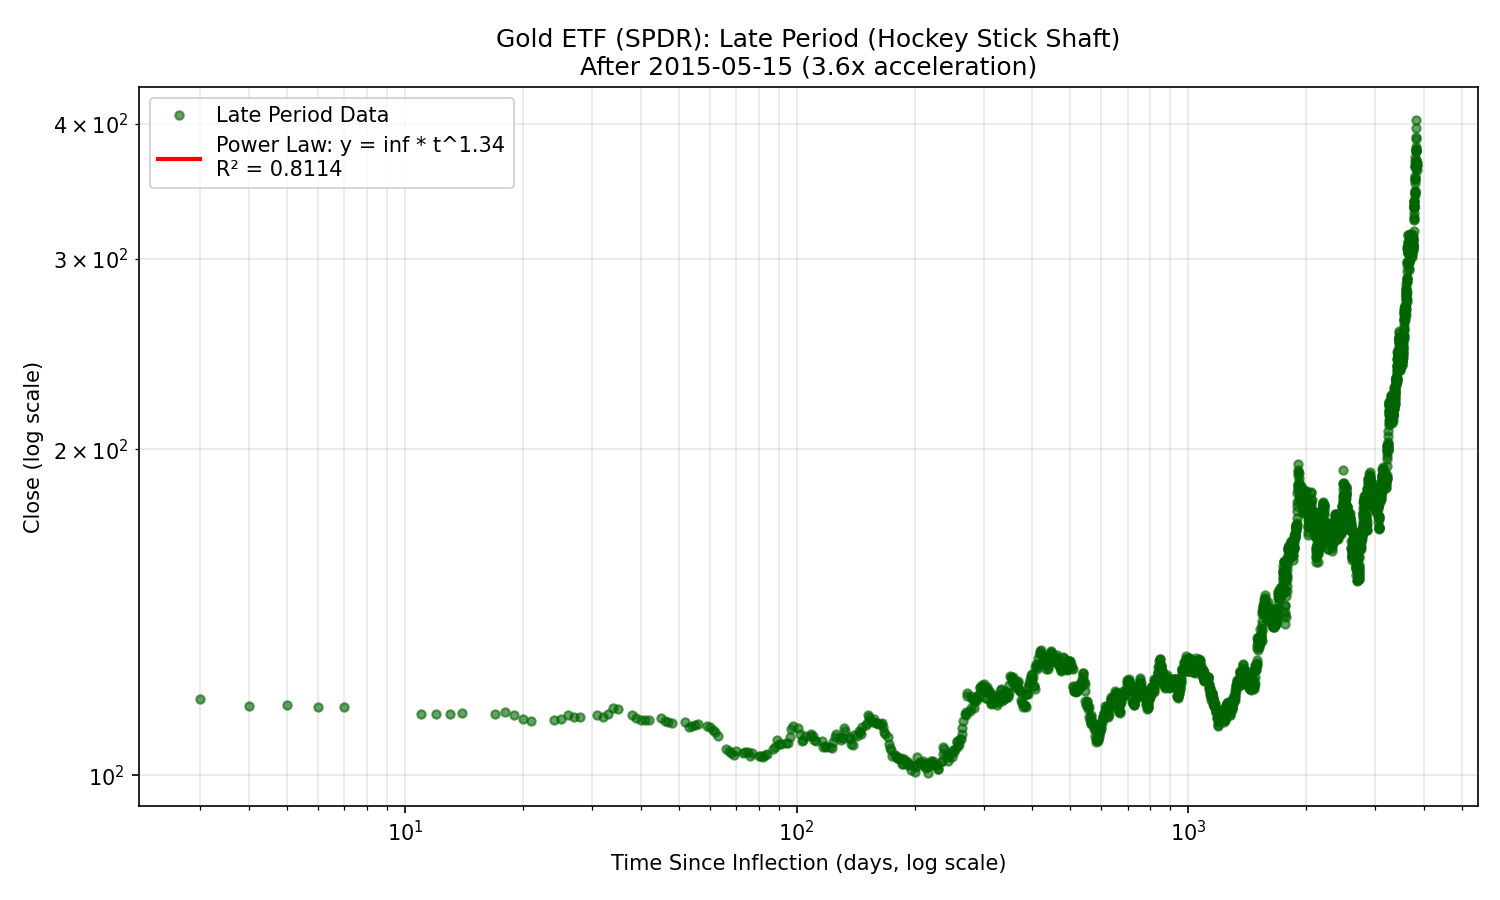
**Late Period (Shaft):**
- R² = 0.8114
- Exponent = 1.34
- Data points = 2638
**Growth Acceleration:** 3.6x faster in late period
**Model Improvement:** Split model R² = 0.8504 vs Single R² = 0.7523 (+0.0981)
**Analysis:** Asset shows distinct regime change - early slow growth followed by acceleration

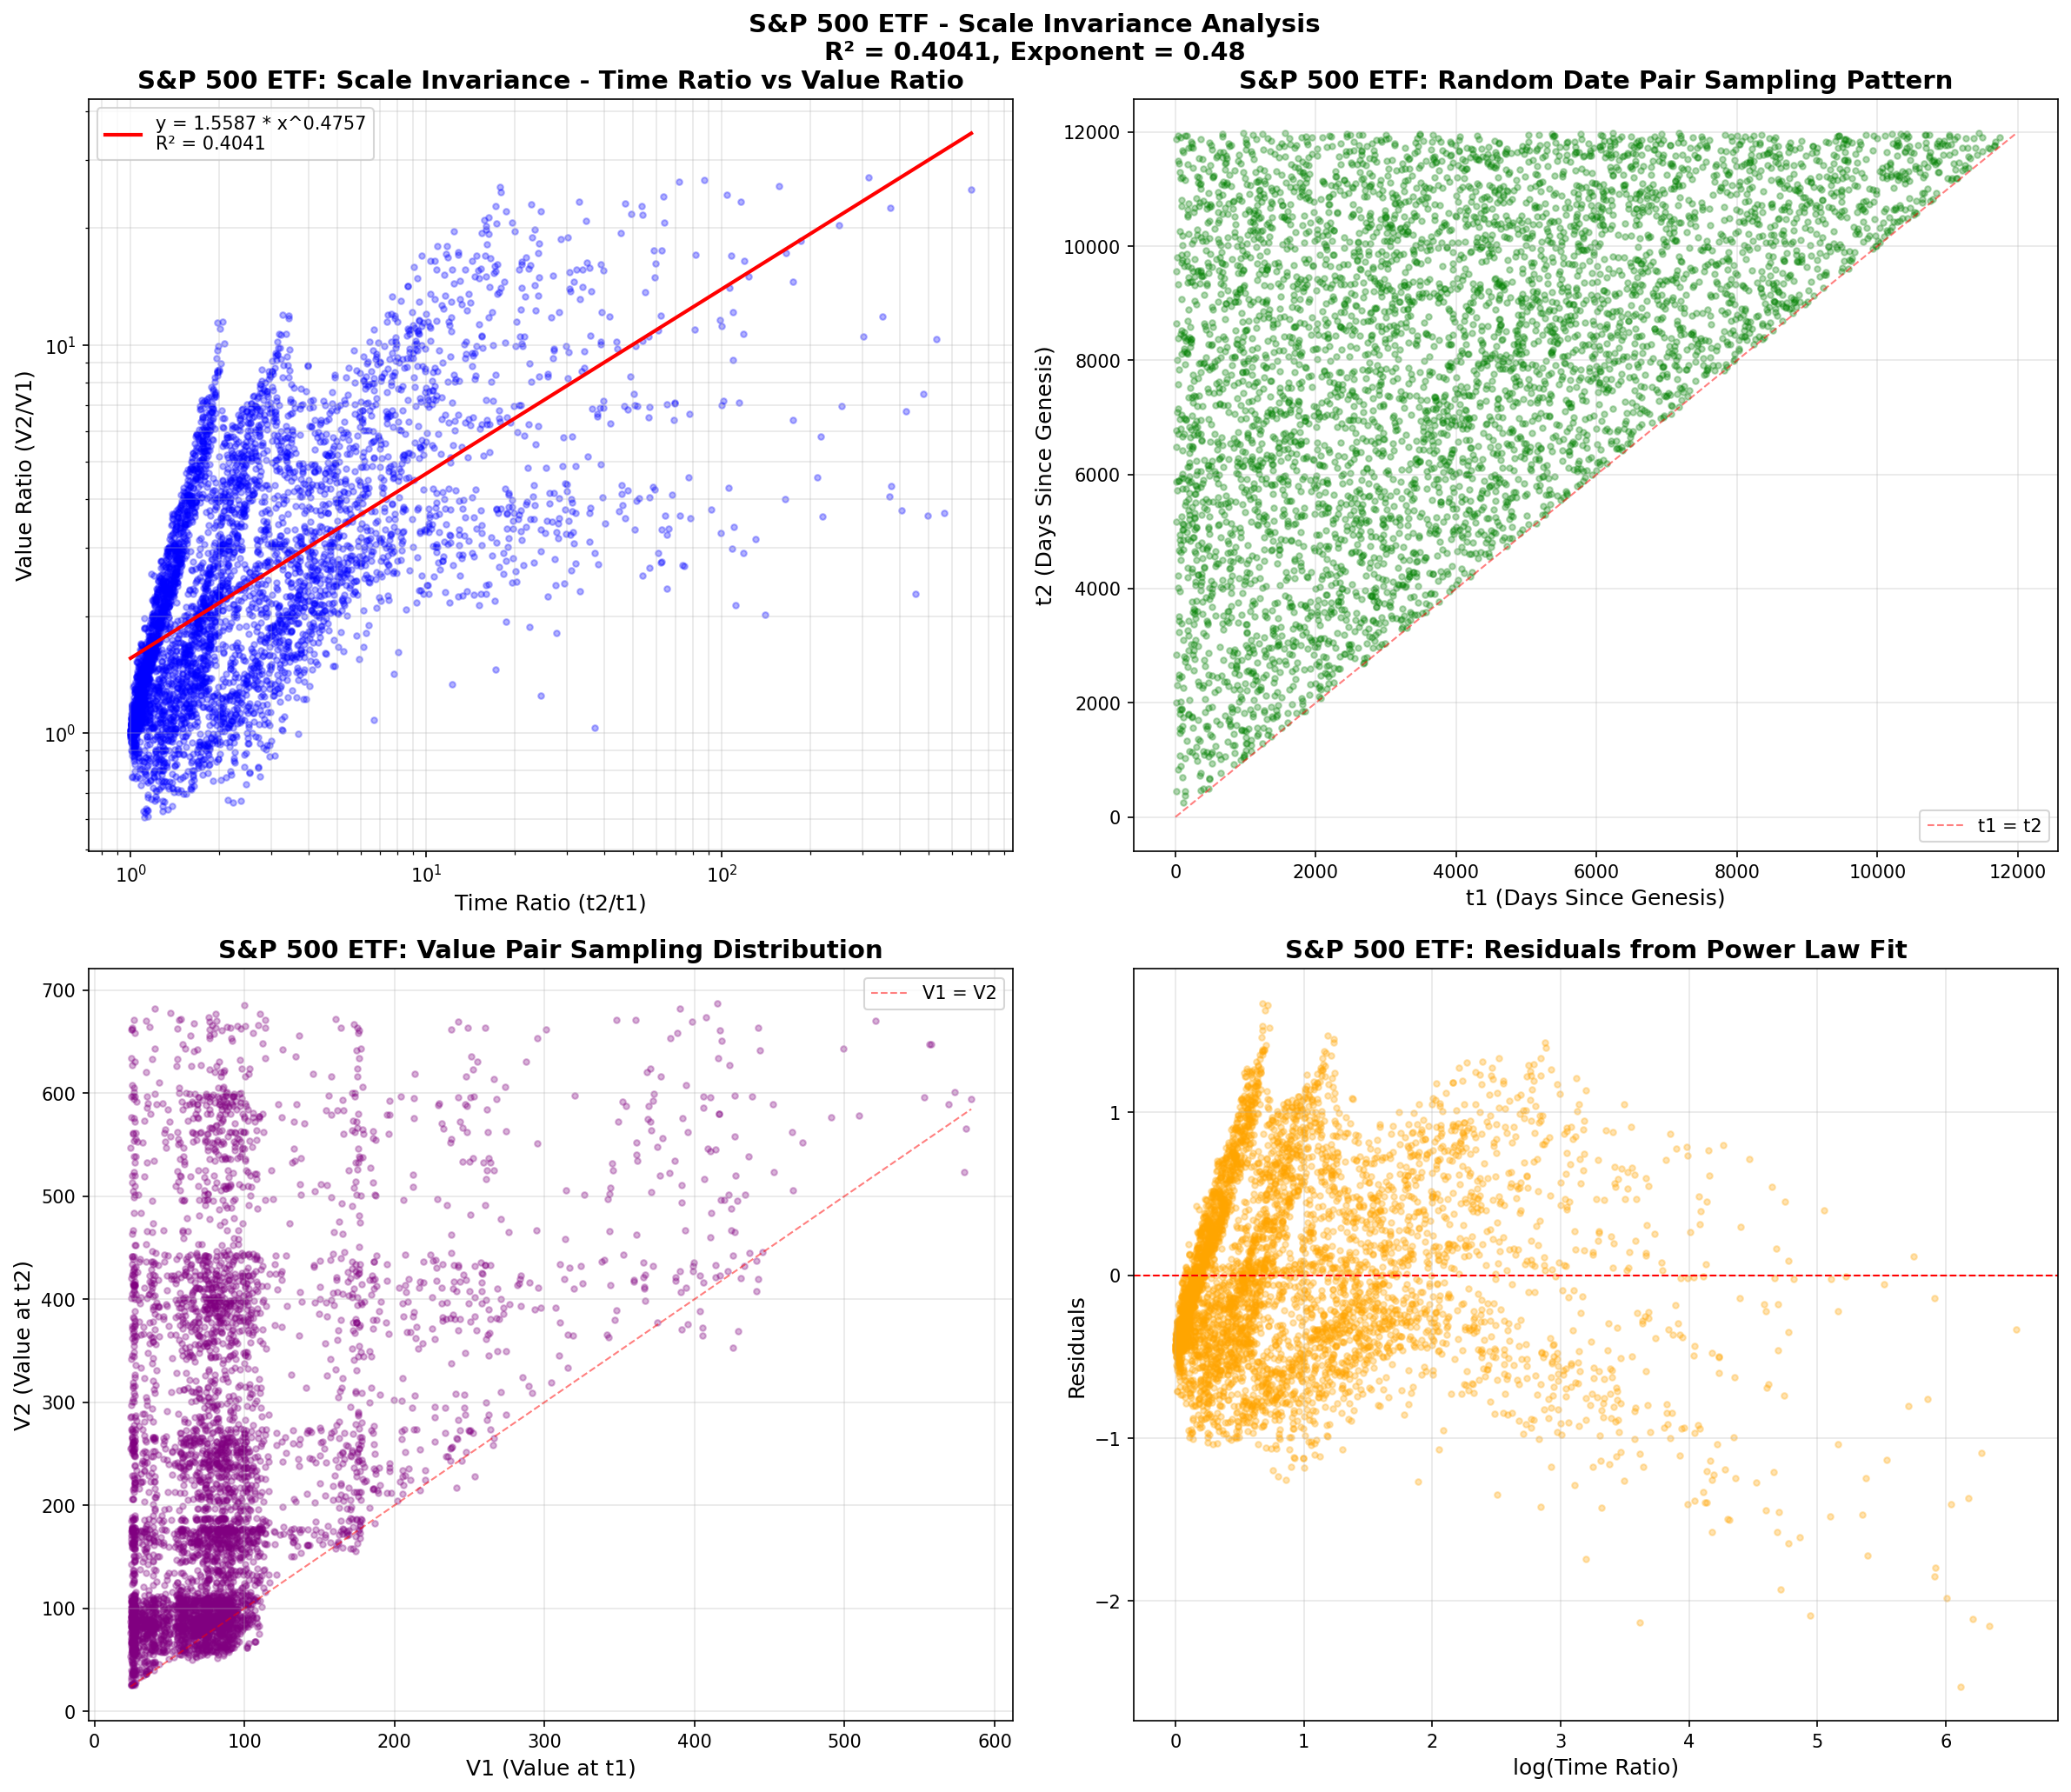
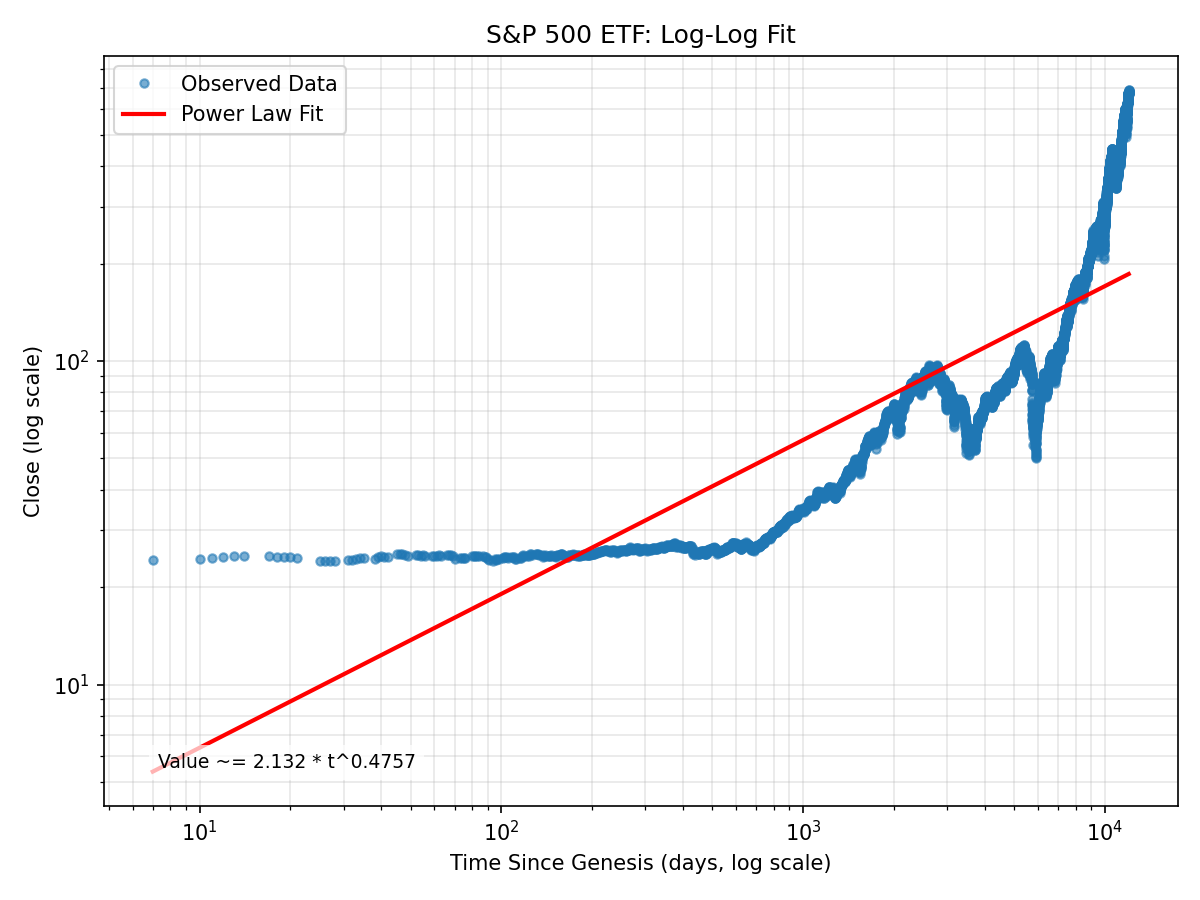
S&P 500 ETF
**R² (Scale Invariance):** 0.4041
**Power Law Exponent:** 0.48
**Data Points:** 8,252
**Date Range:** 1993-01-29 to 2025-11-07
**Log Residual Std Dev:** 0.5001
**Data Source:** Yahoo Finance API (yfinance Python library)
**Genesis Date:** 1993-01-22 (Provided)
**Power Law Fit:** Value ~= 2.132 * t^0.4757
Saturation Analysis (S-Curve Detection):
**⚡ POWER-LAW GROWTH** (Not saturating)
**Sigmoid R²:** 0.9778 vs Linear R²: 0.7296
**Current Value:** 0.0% of sigmoid model maximum
**Assessment:** No evidence of saturation or S-curve behavior
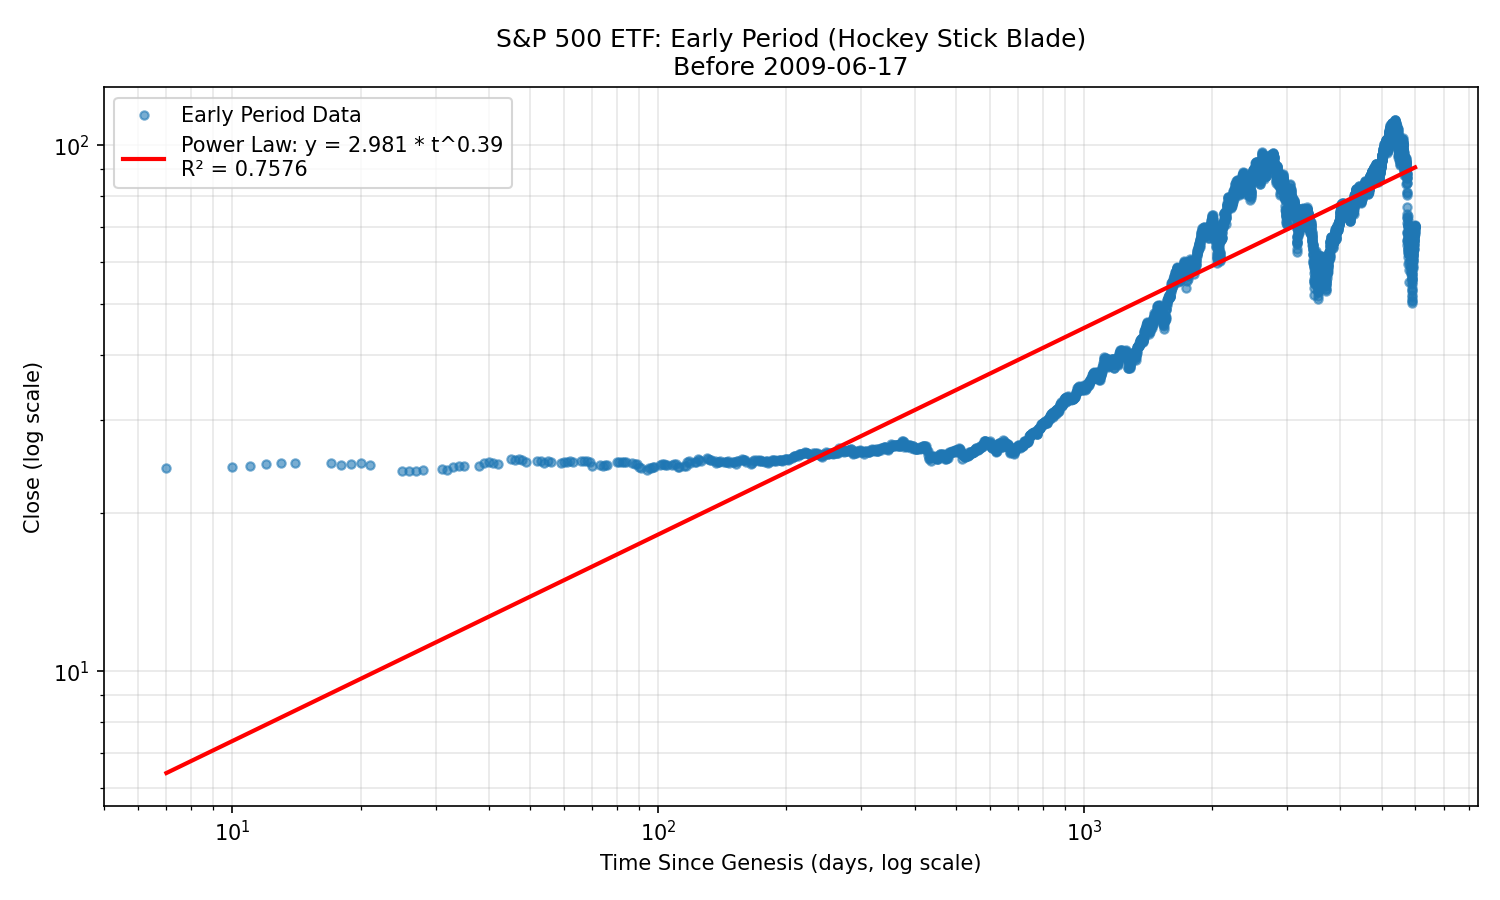
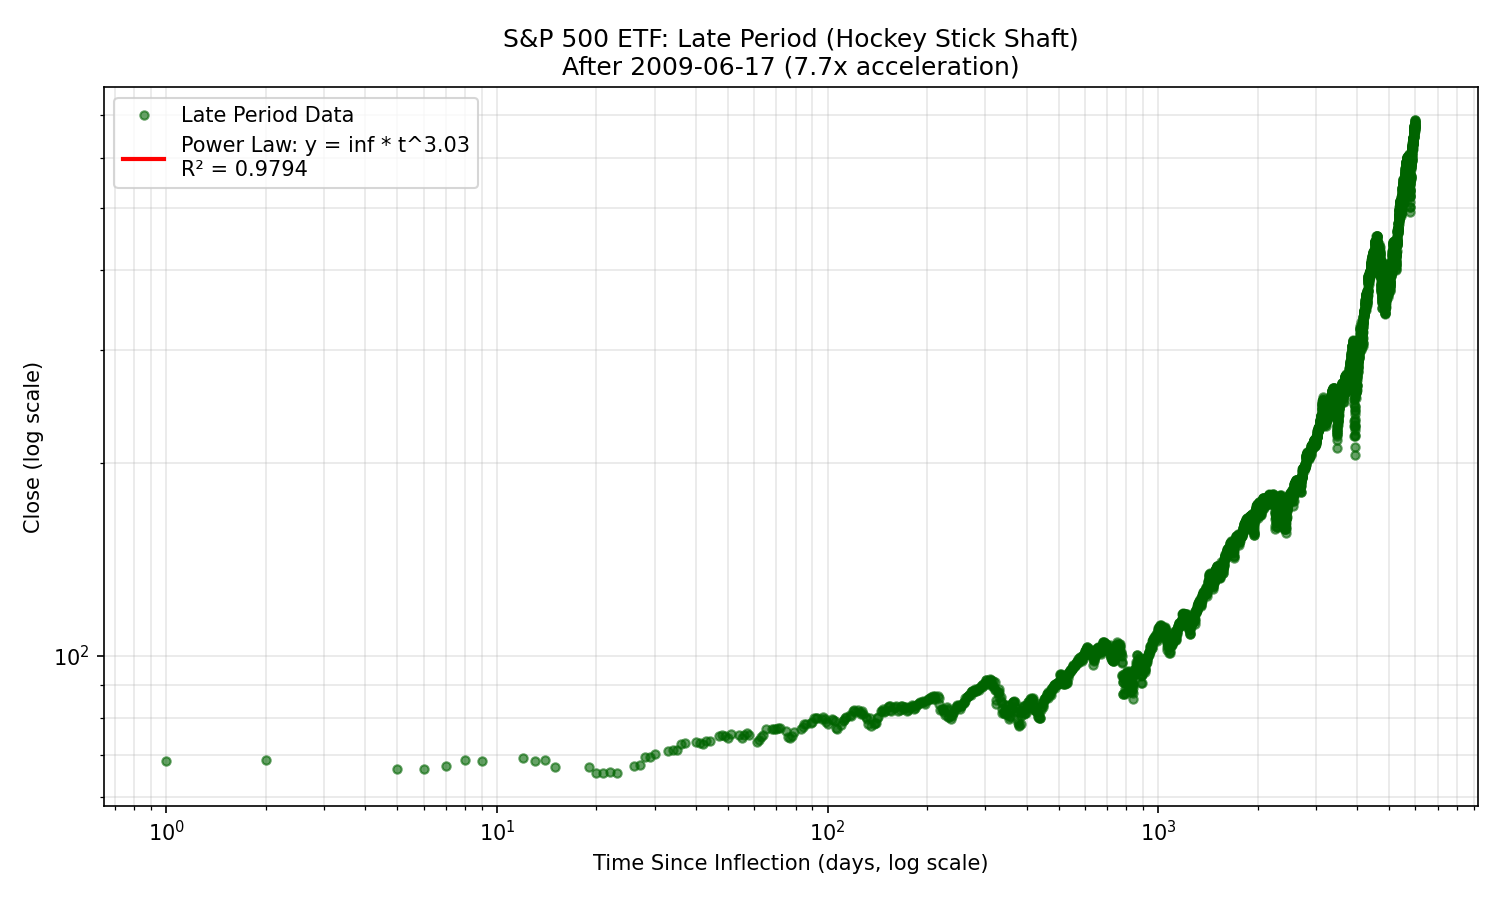
Hockey Stick Pattern Detected:
**🏒 INFLECTION POINT:** 2009-06-17
**Early Period (Blade):**
- R² = 0.7576
- Exponent = 0.39
- Data points = 4126
**Late Period (Shaft):**
- R² = 0.9794
- Exponent = 3.03
- Data points = 4126
**Growth Acceleration:** 7.7x faster in late period
**Model Improvement:** Split model R² = 0.9600 vs Single R² = 0.7052 (+0.2547)
**Analysis:** Asset shows distinct regime change - early slow growth followed by acceleration
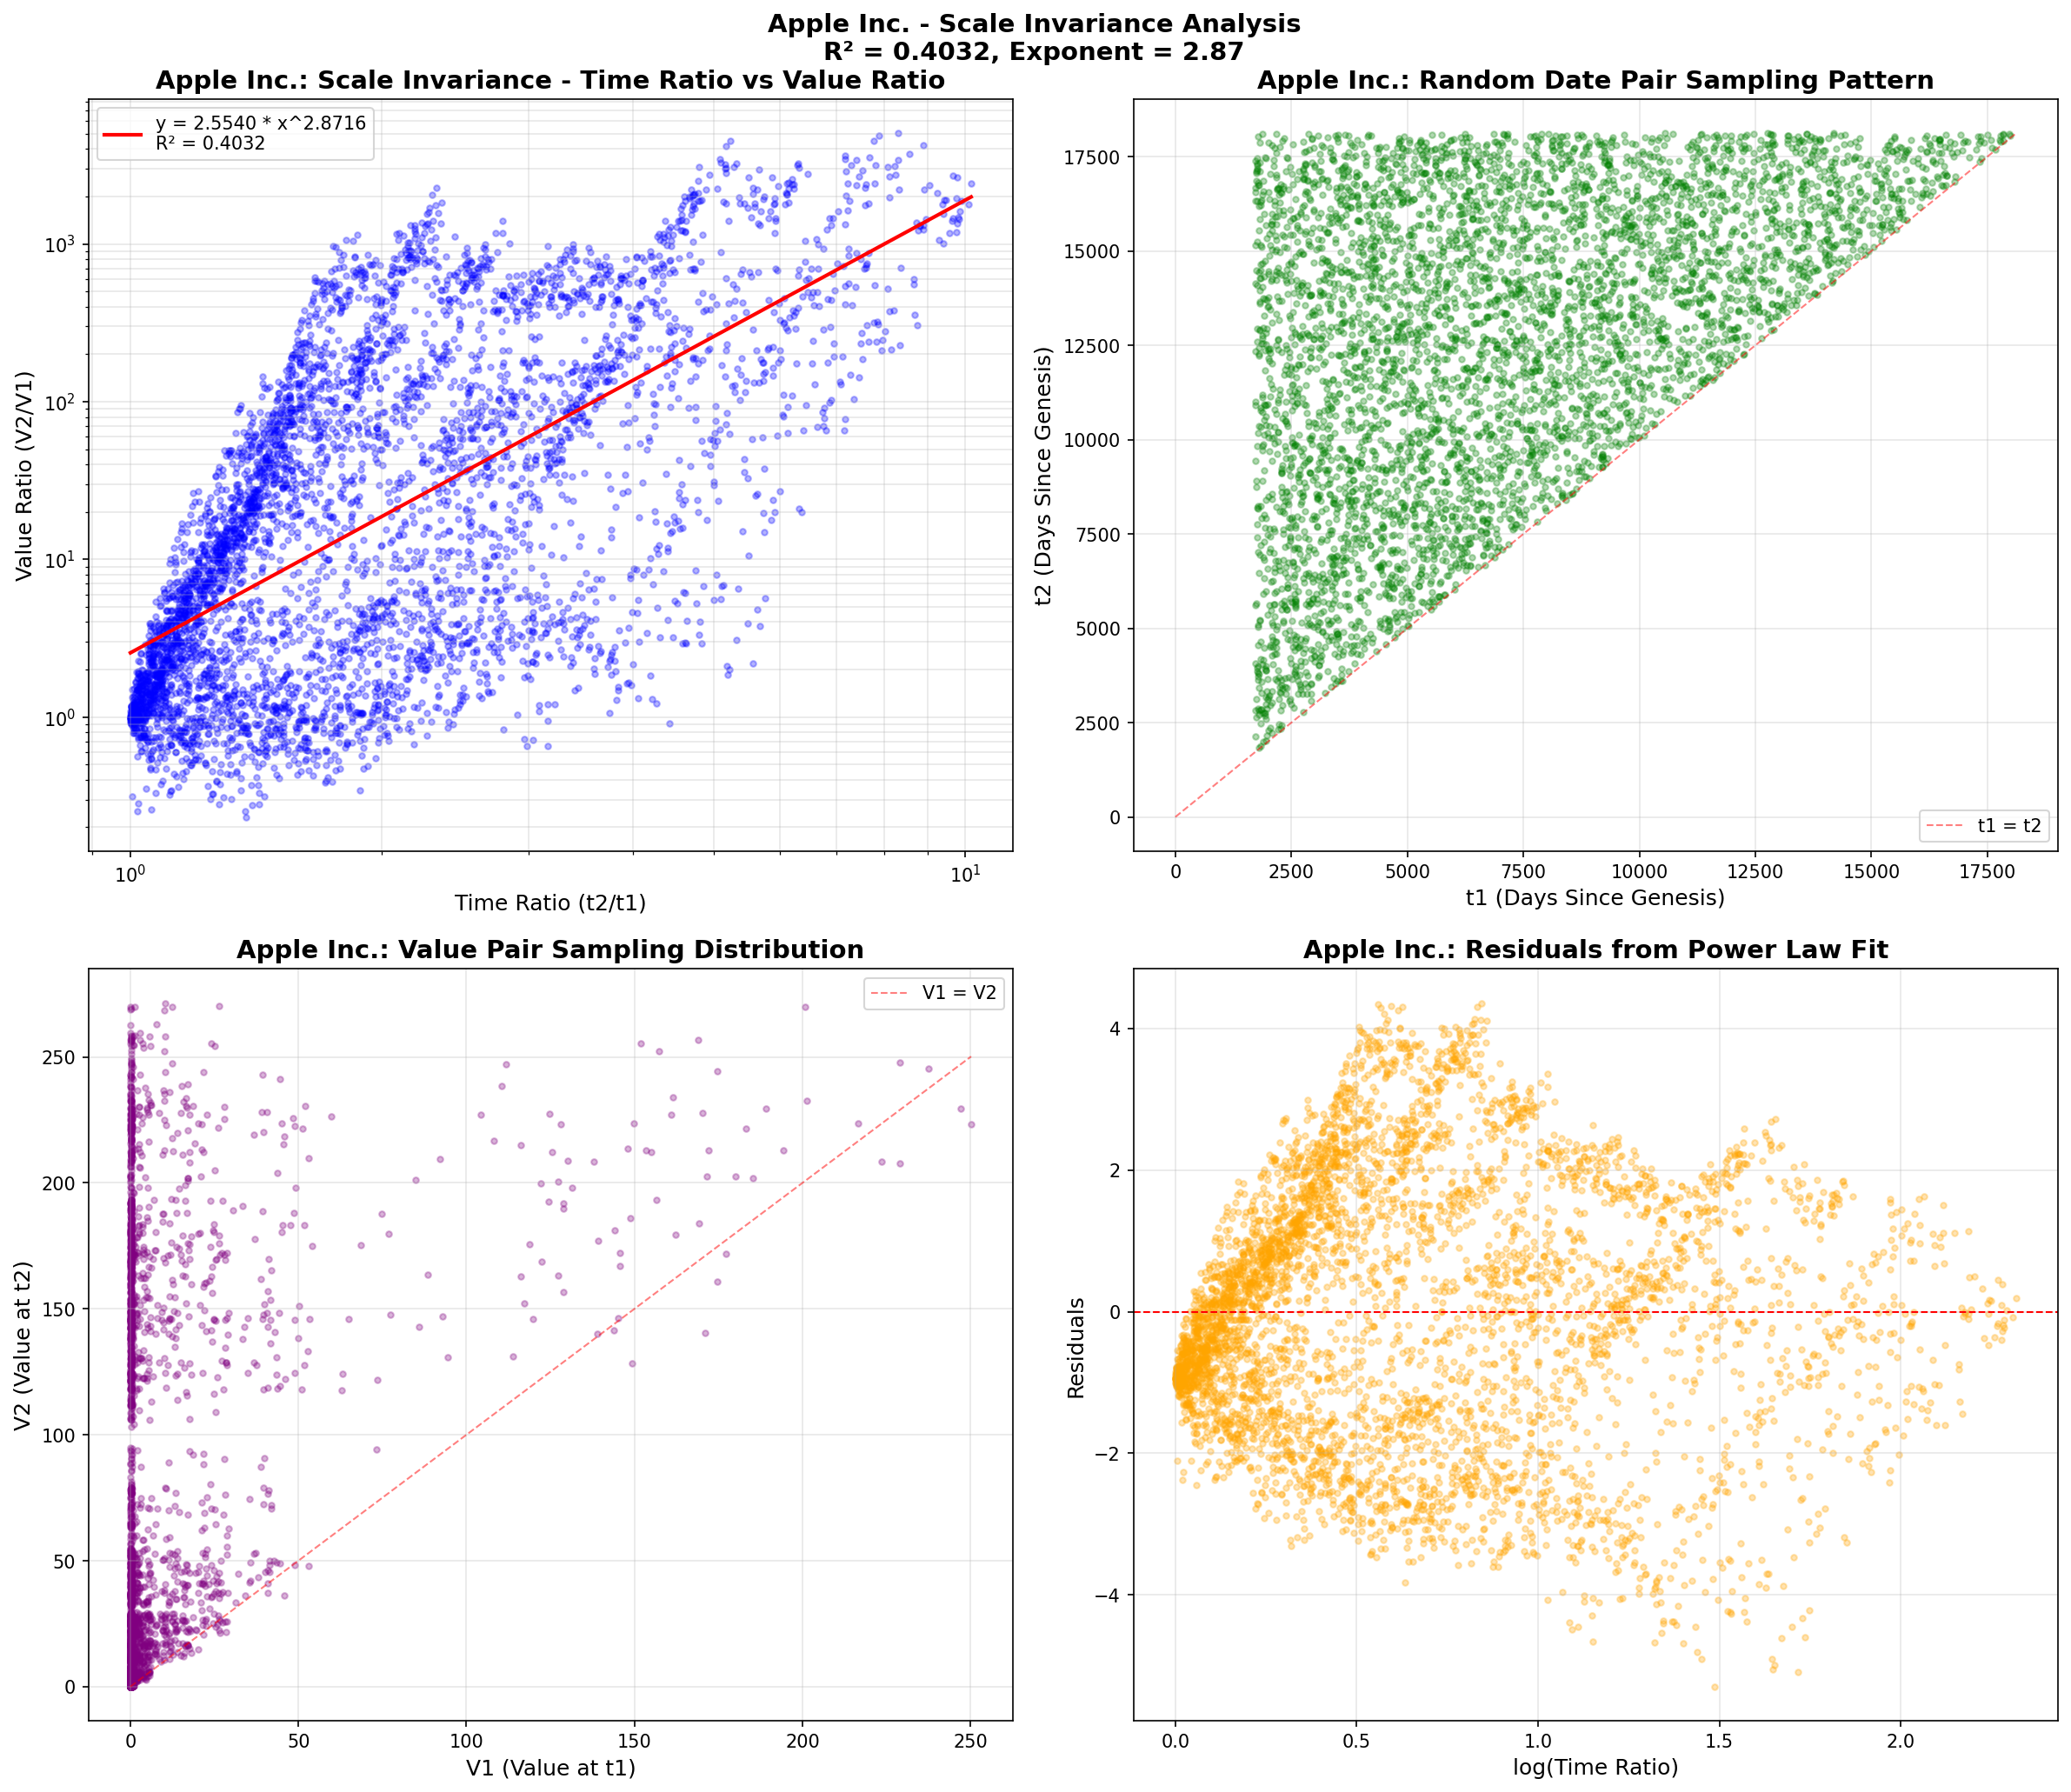
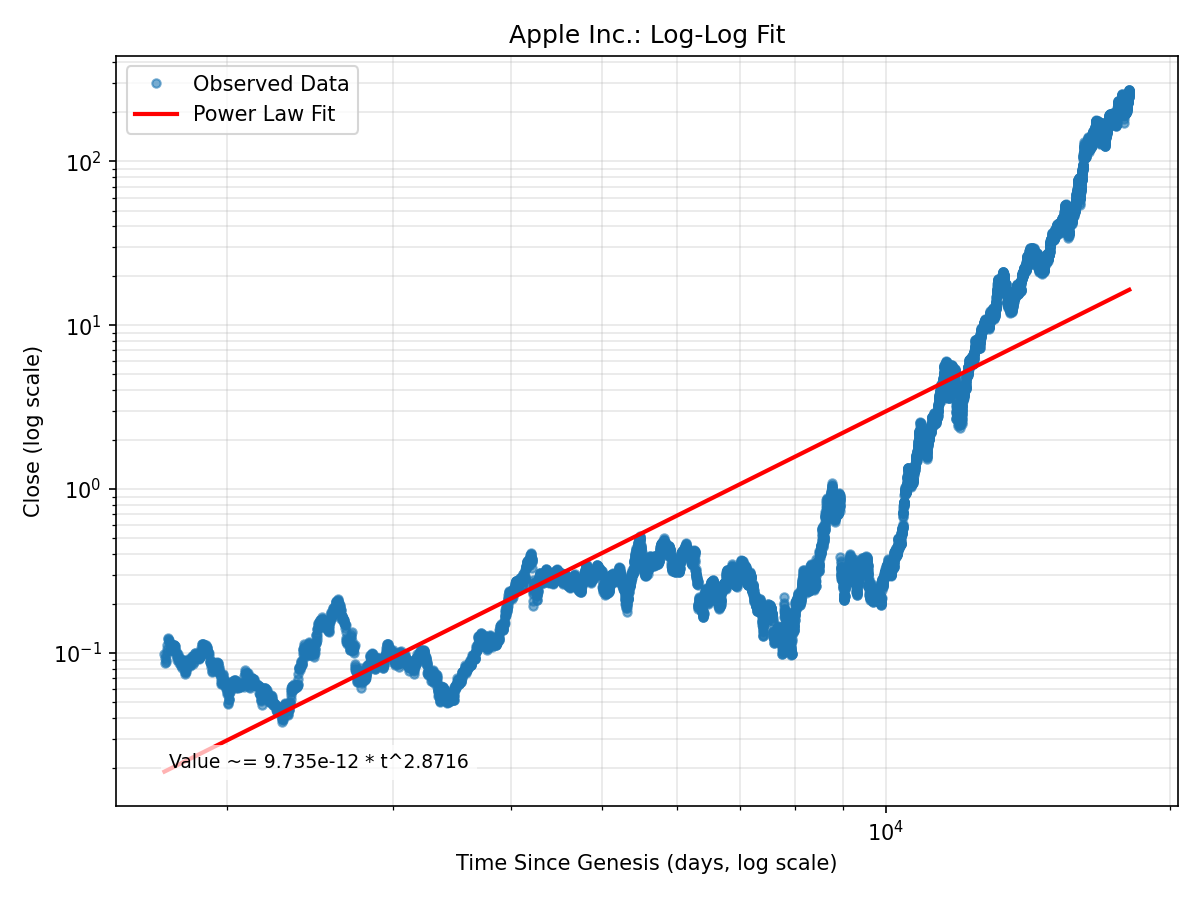
Apple Inc.
**R² (Scale Invariance):** 0.4032
**Power Law Exponent:** 2.87
**Data Points:** 11,319
**Date Range:** 1980-12-12 to 2025-11-07
**Log Residual Std Dev:** 1.4324
**Data Source:** Yahoo Finance API (yfinance Python library)
**Genesis Date:** 1976-04-01 (Provided)
**Power Law Fit:** Value ~= 9.735e-12 * t^2.8716
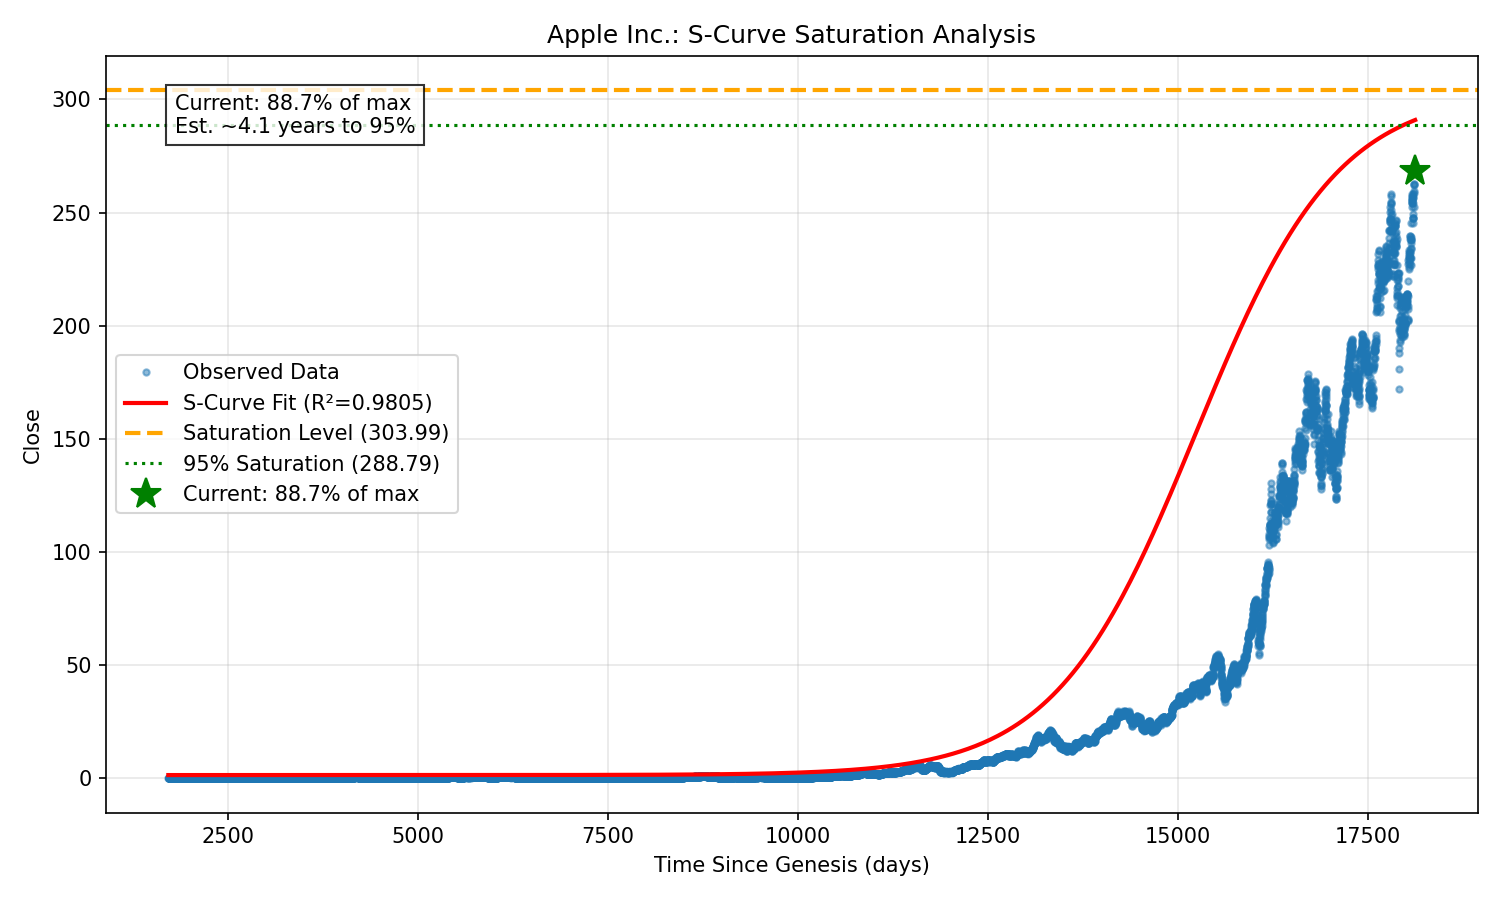
Saturation Analysis (S-Curve Detection):
**📈 S-CURVE DETECTED** (Sigmoid R² = 0.9805 vs Linear R² = 0.4632)
**Current Progress:** 88.7% of estimated maximum
**Saturation Level:** 3.03e+02 (estimated carrying capacity)
**Estimated Time to 95% Saturation:** ~4.1 years
**Growth Pattern:** Decelerating (-5078.8% slowdown in recent period)
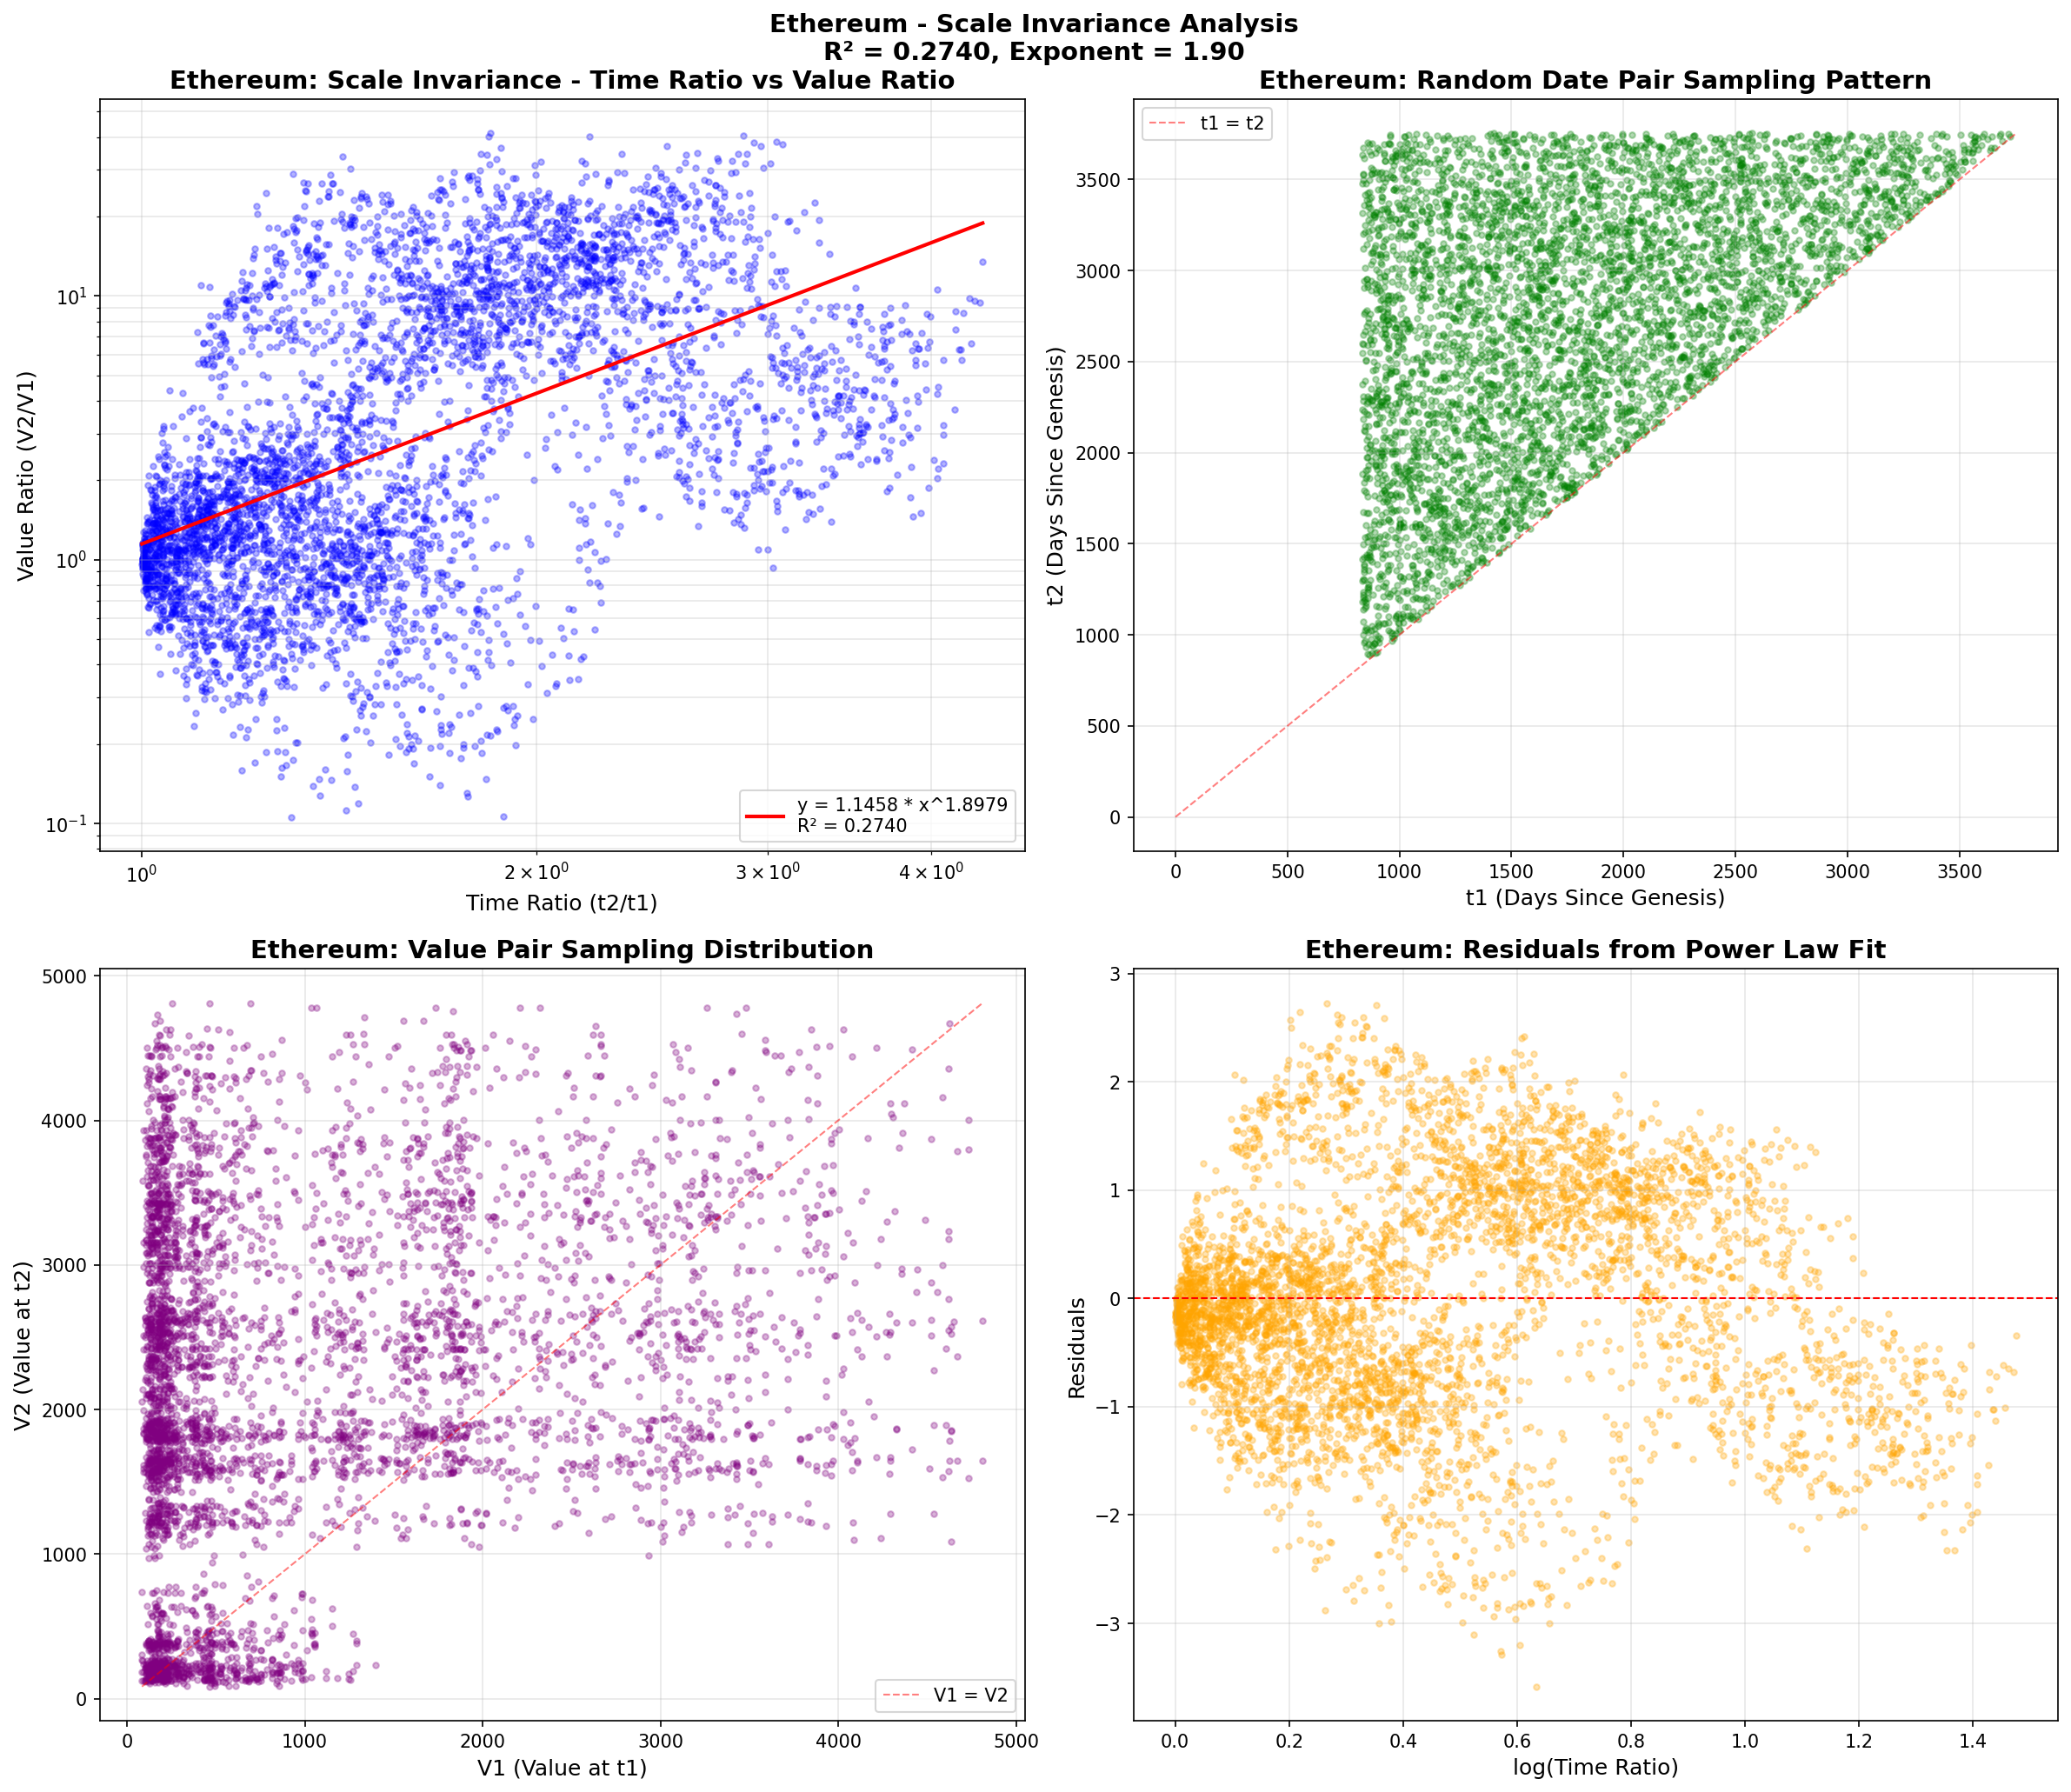
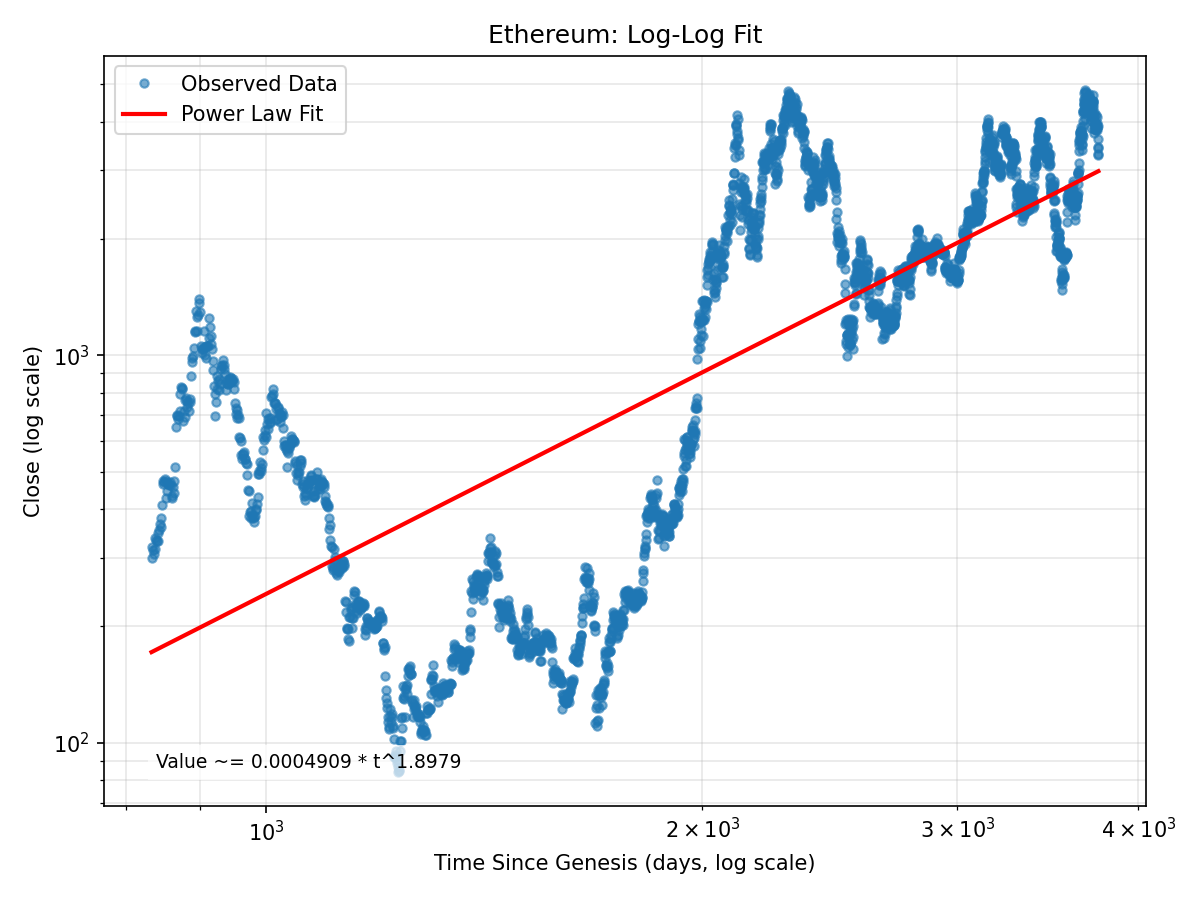
Ethereum
**R² (Scale Invariance):** 0.2740
**Power Law Exponent:** 1.90
**Data Points:** 2,921
**Date Range:** 2017-11-09 to 2025-11-07
**Log Residual Std Dev:** 0.7583
**Data Source:** Yahoo Finance API (yfinance Python library)
**Genesis Date:** 2015-07-30 (Provided)
**Power Law Fit:** Value ~= 0.0004909 * t^1.8979
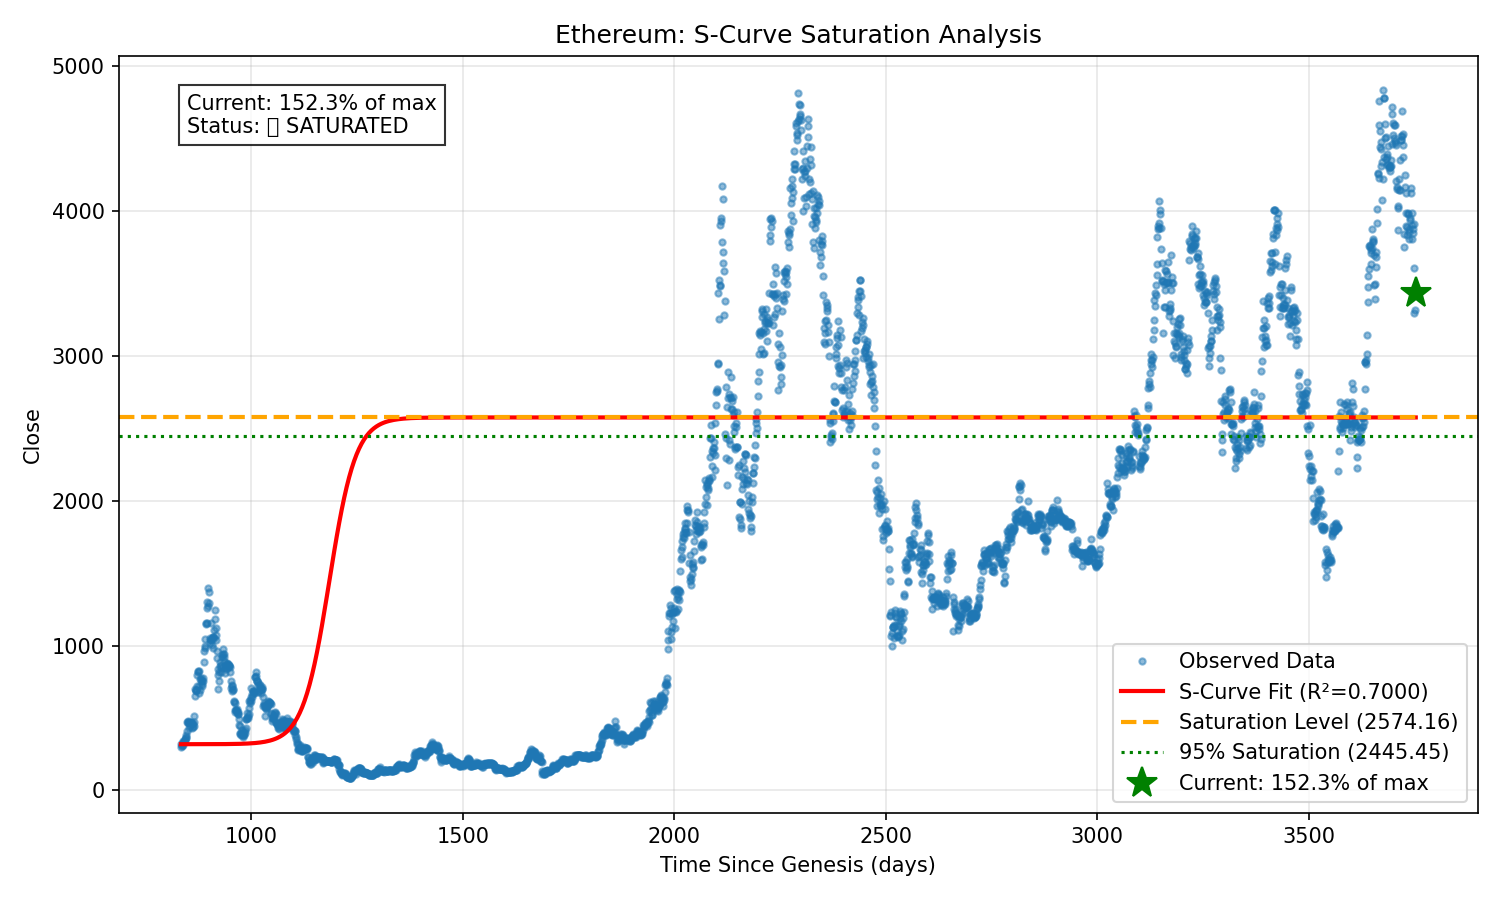
Saturation Analysis (S-Curve Detection):
**📈 S-CURVE DETECTED** (Sigmoid R² = 0.7000 vs Linear R² = 0.5743)
**Current Progress:** 152.3% of estimated maximum
**Saturation Level:** 2.26e+03 (estimated carrying capacity)
**✅ HAS REACHED SATURATION** (≥95% of maximum)
**Growth Pattern:** Decelerating (22.3% slowdown in recent period)
Financial Asset - Split
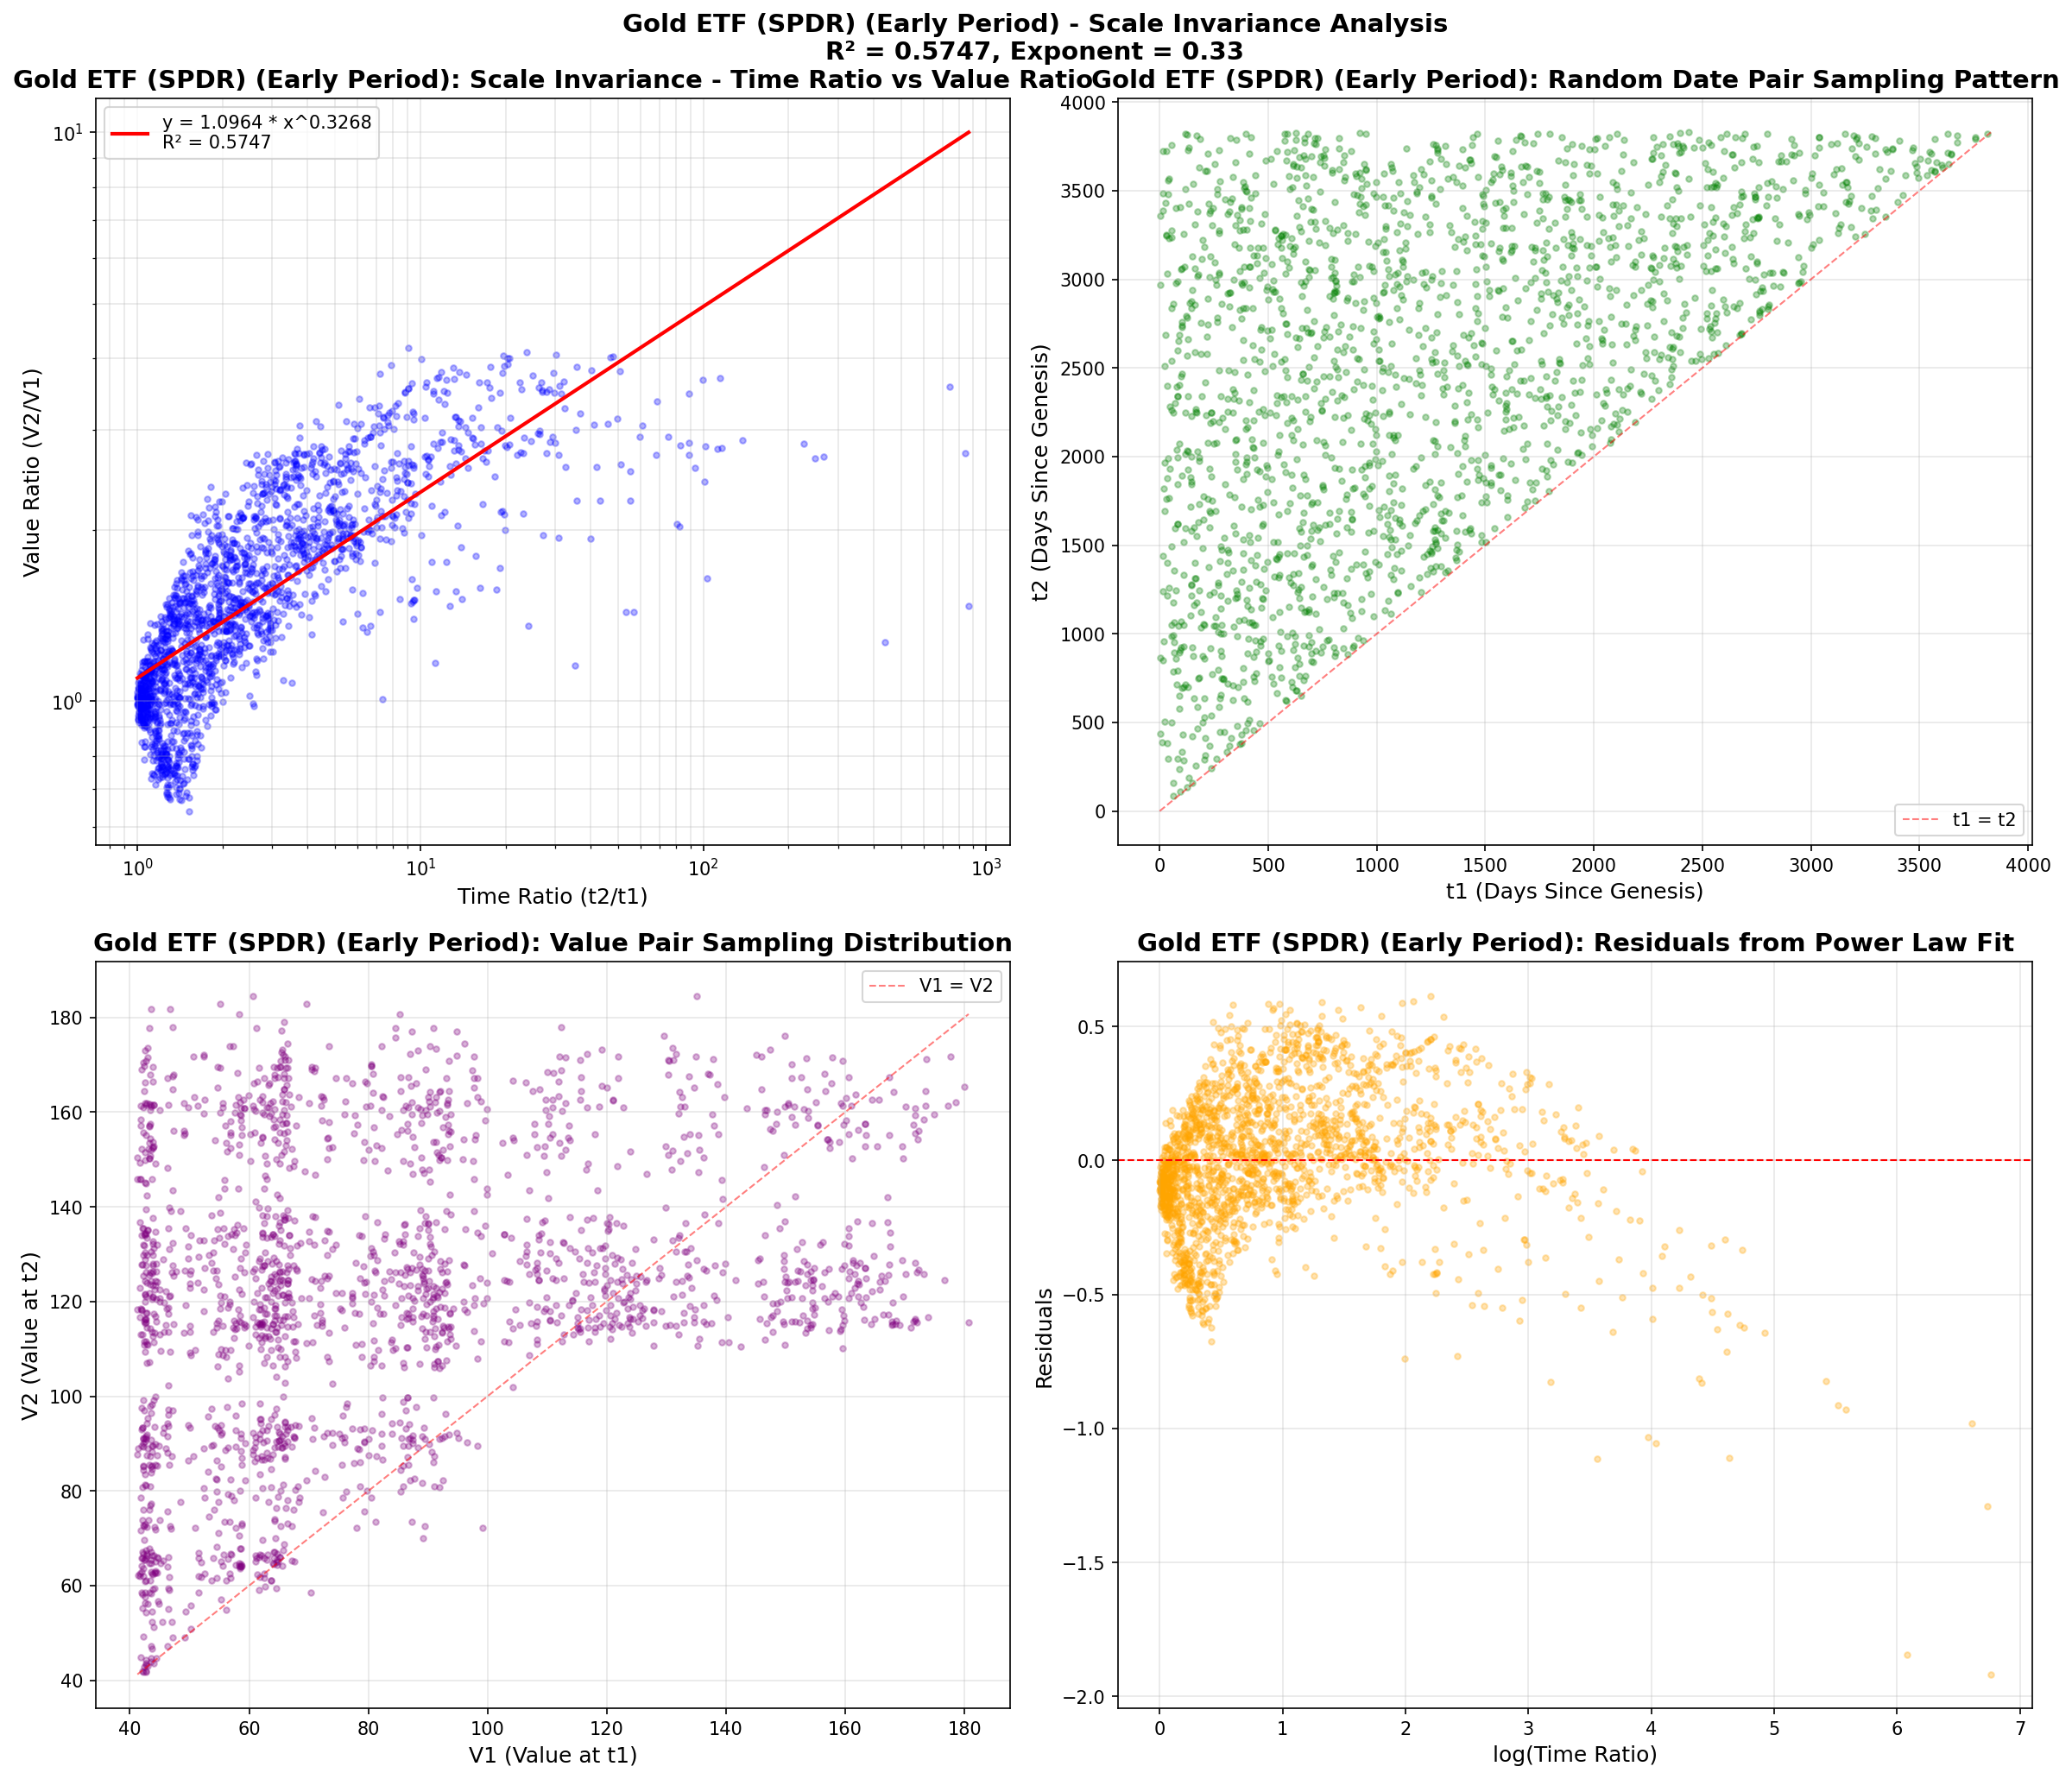
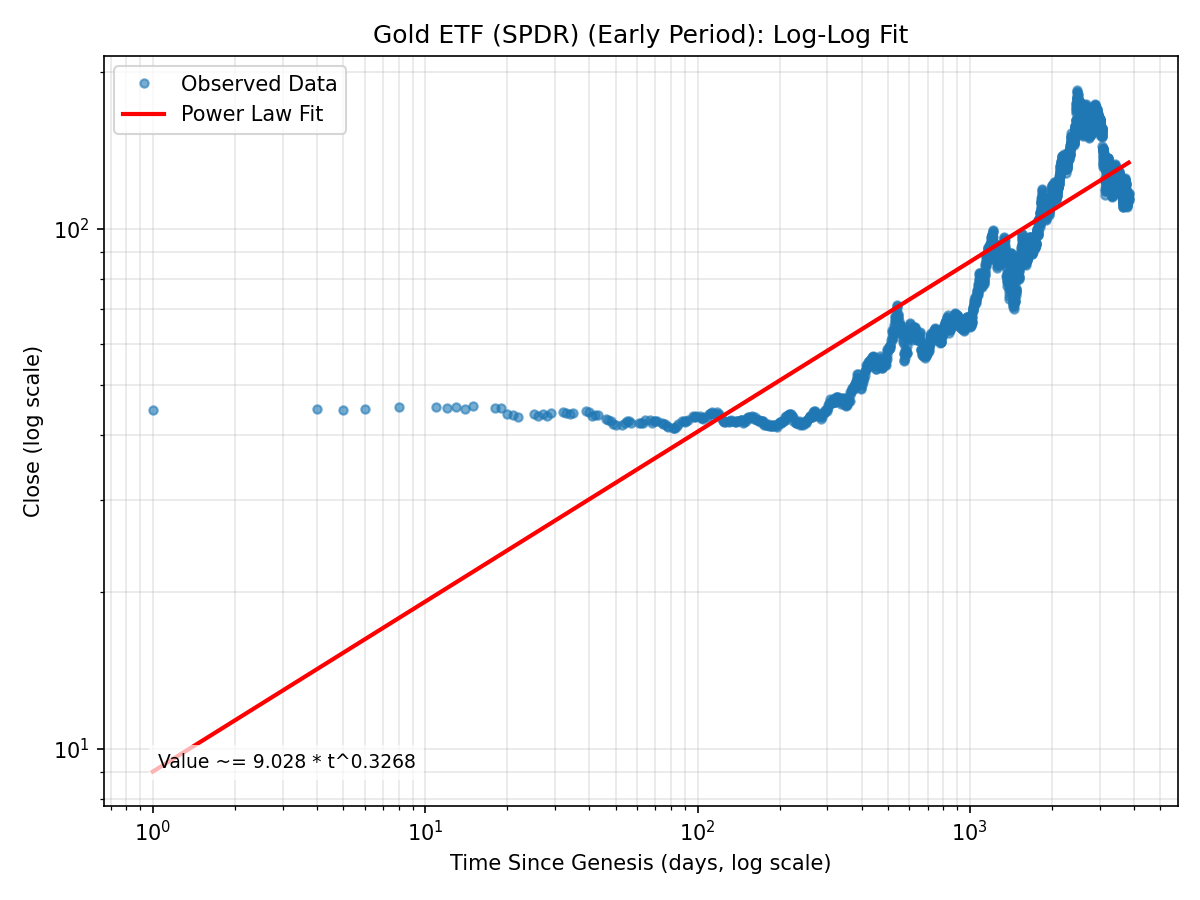
Gold ETF (SPDR) (Early Period)
**R² (Scale Invariance):** 0.5747
**Power Law Exponent:** 0.33
**Data Points:** 2,639
**Date Range:** 2004-11-18 to 2015-05-14
**Log Residual Std Dev:** 0.2031
**Data Source:** Yahoo Finance API (yfinance Python library)
**Genesis Date:** 2004-11-18 (Provided)
**Power Law Fit:** Value ~= 9.028 * t^0.3268
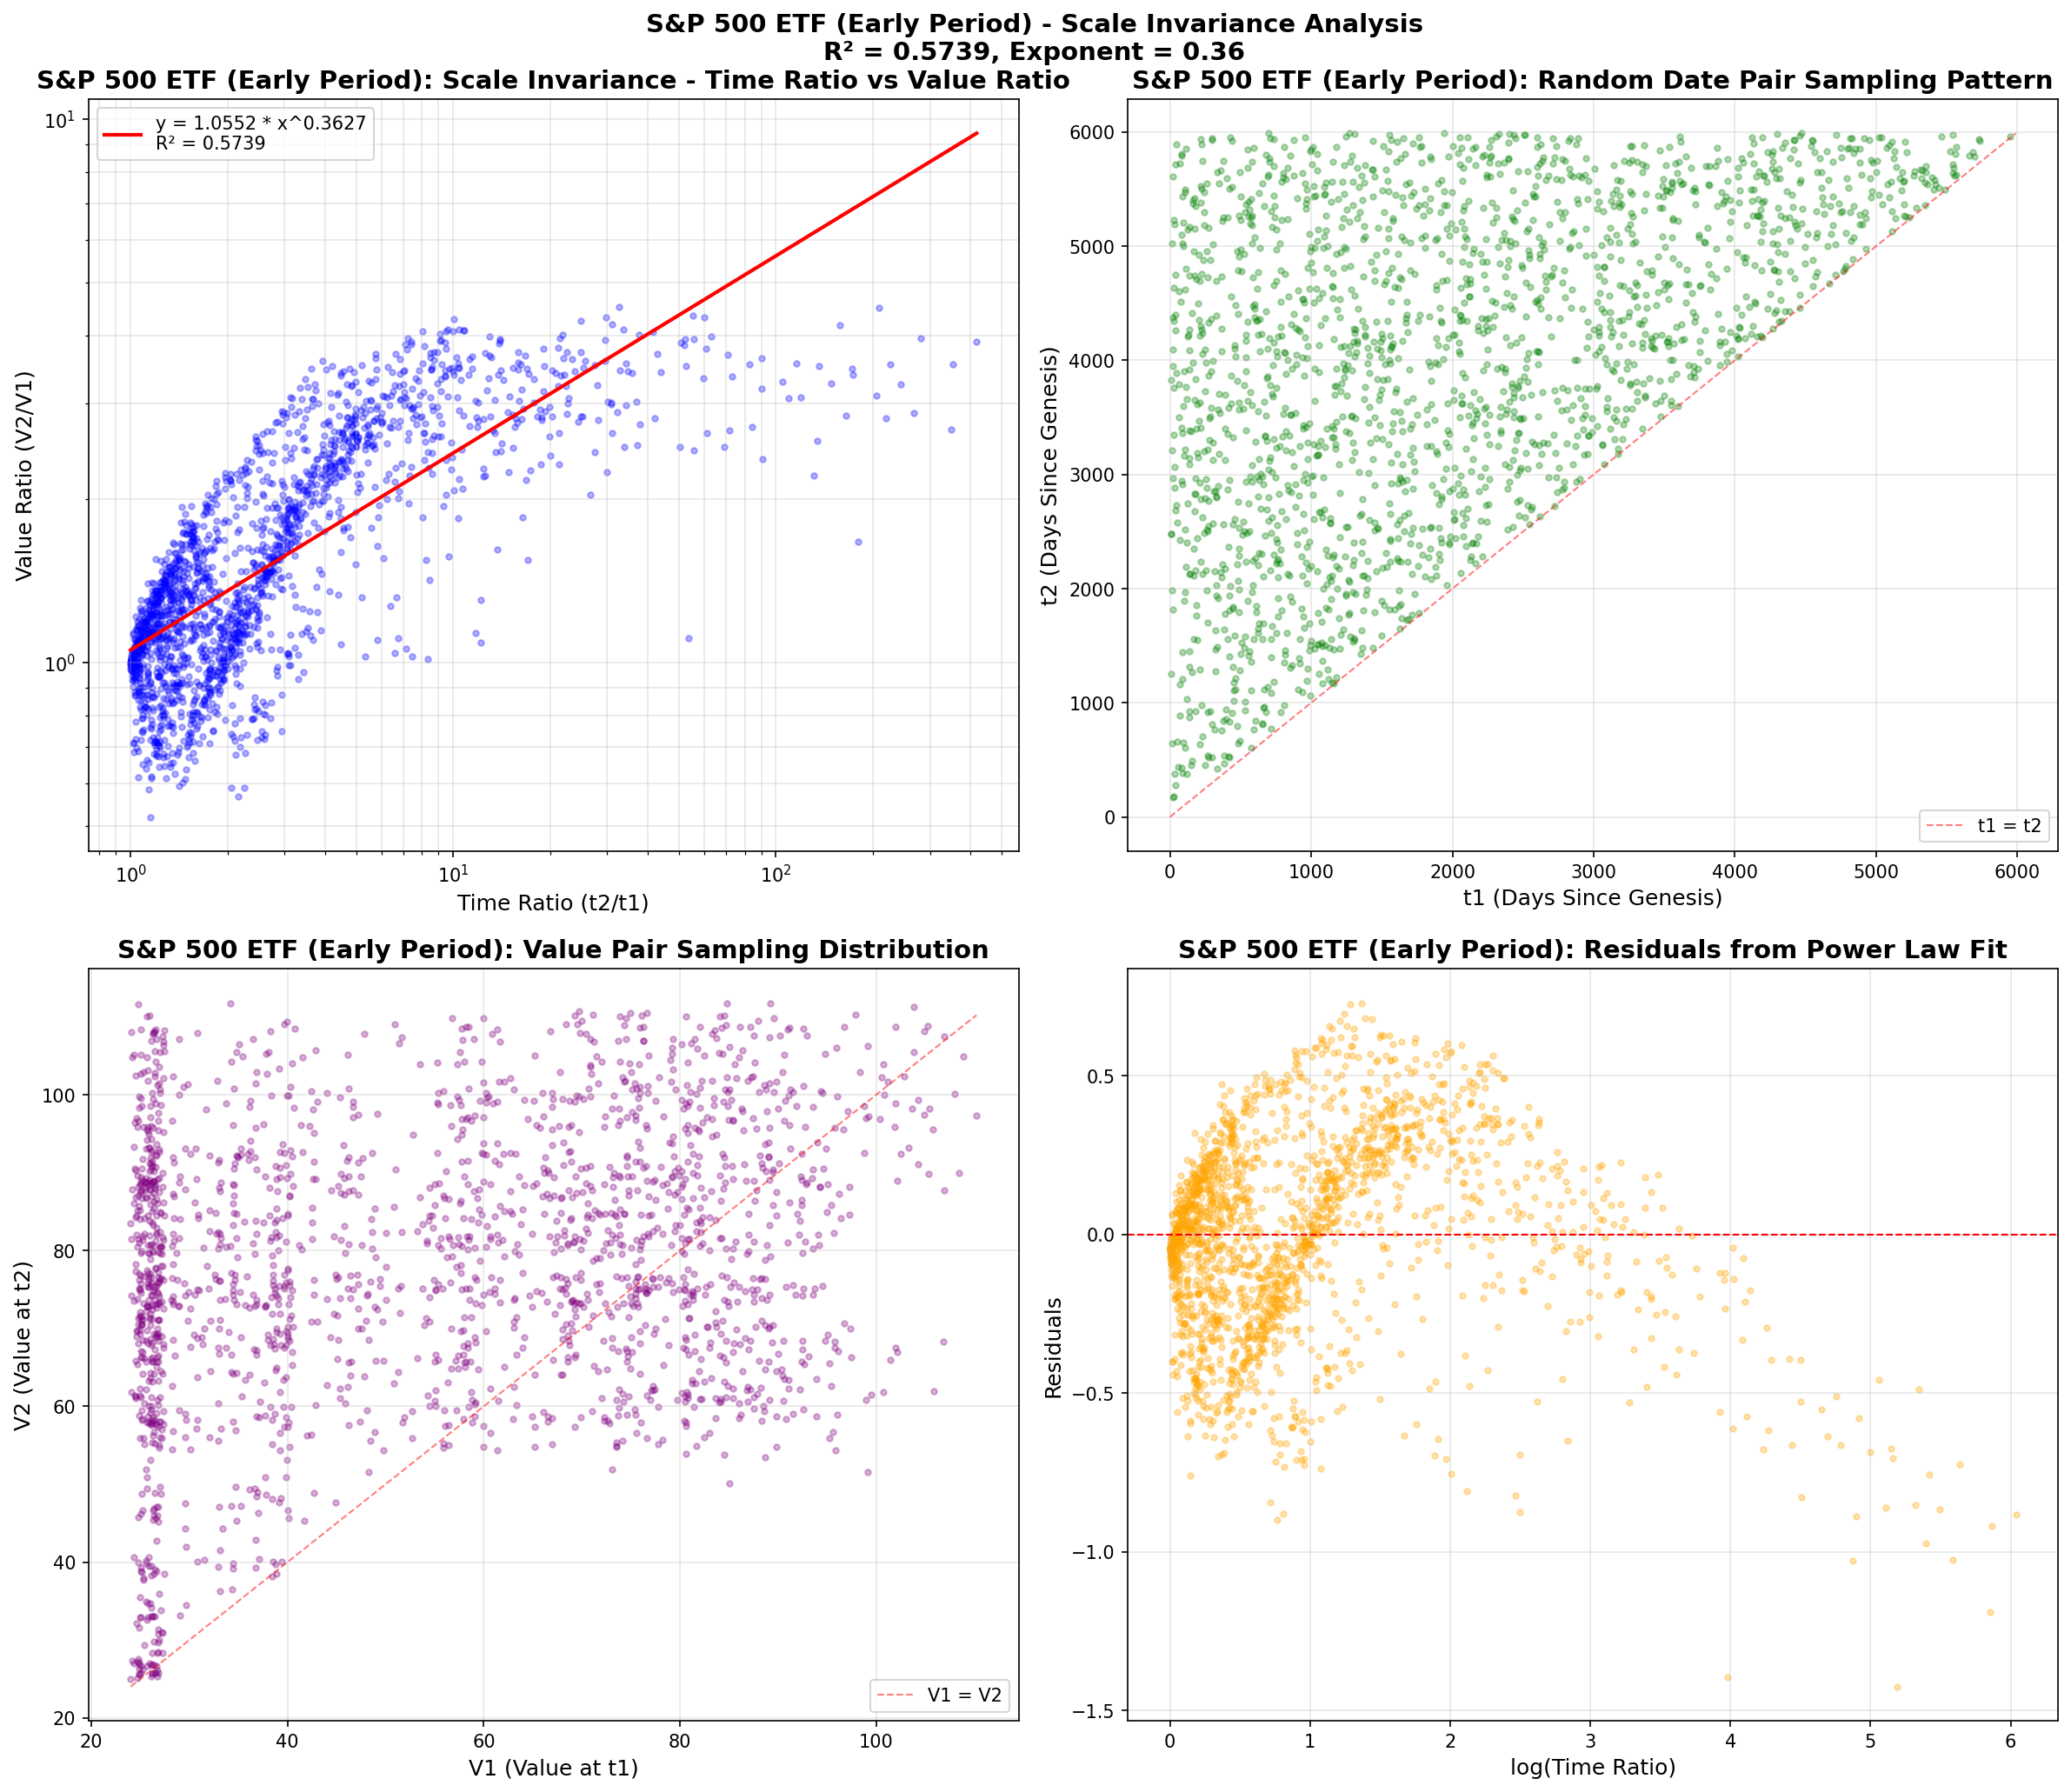
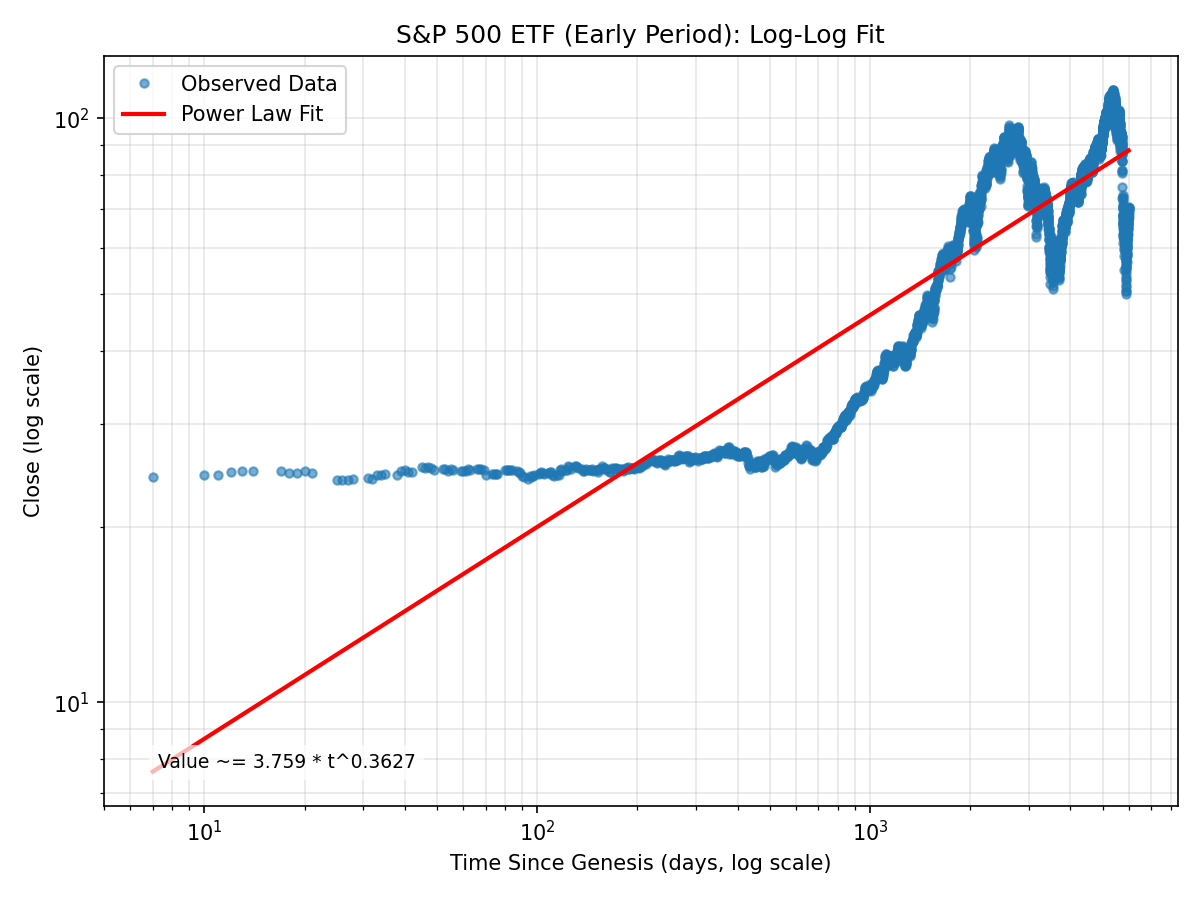
S&P 500 ETF (Early Period)
**R² (Scale Invariance):** 0.5739
**Power Law Exponent:** 0.36
**Data Points:** 4,126
**Date Range:** 1993-01-29 to 2009-06-16
**Log Residual Std Dev:** 0.2184
**Data Source:** Yahoo Finance API (yfinance Python library)
**Genesis Date:** 1993-01-22 (Provided)
**Power Law Fit:** Value ~= 3.759 * t^0.3627
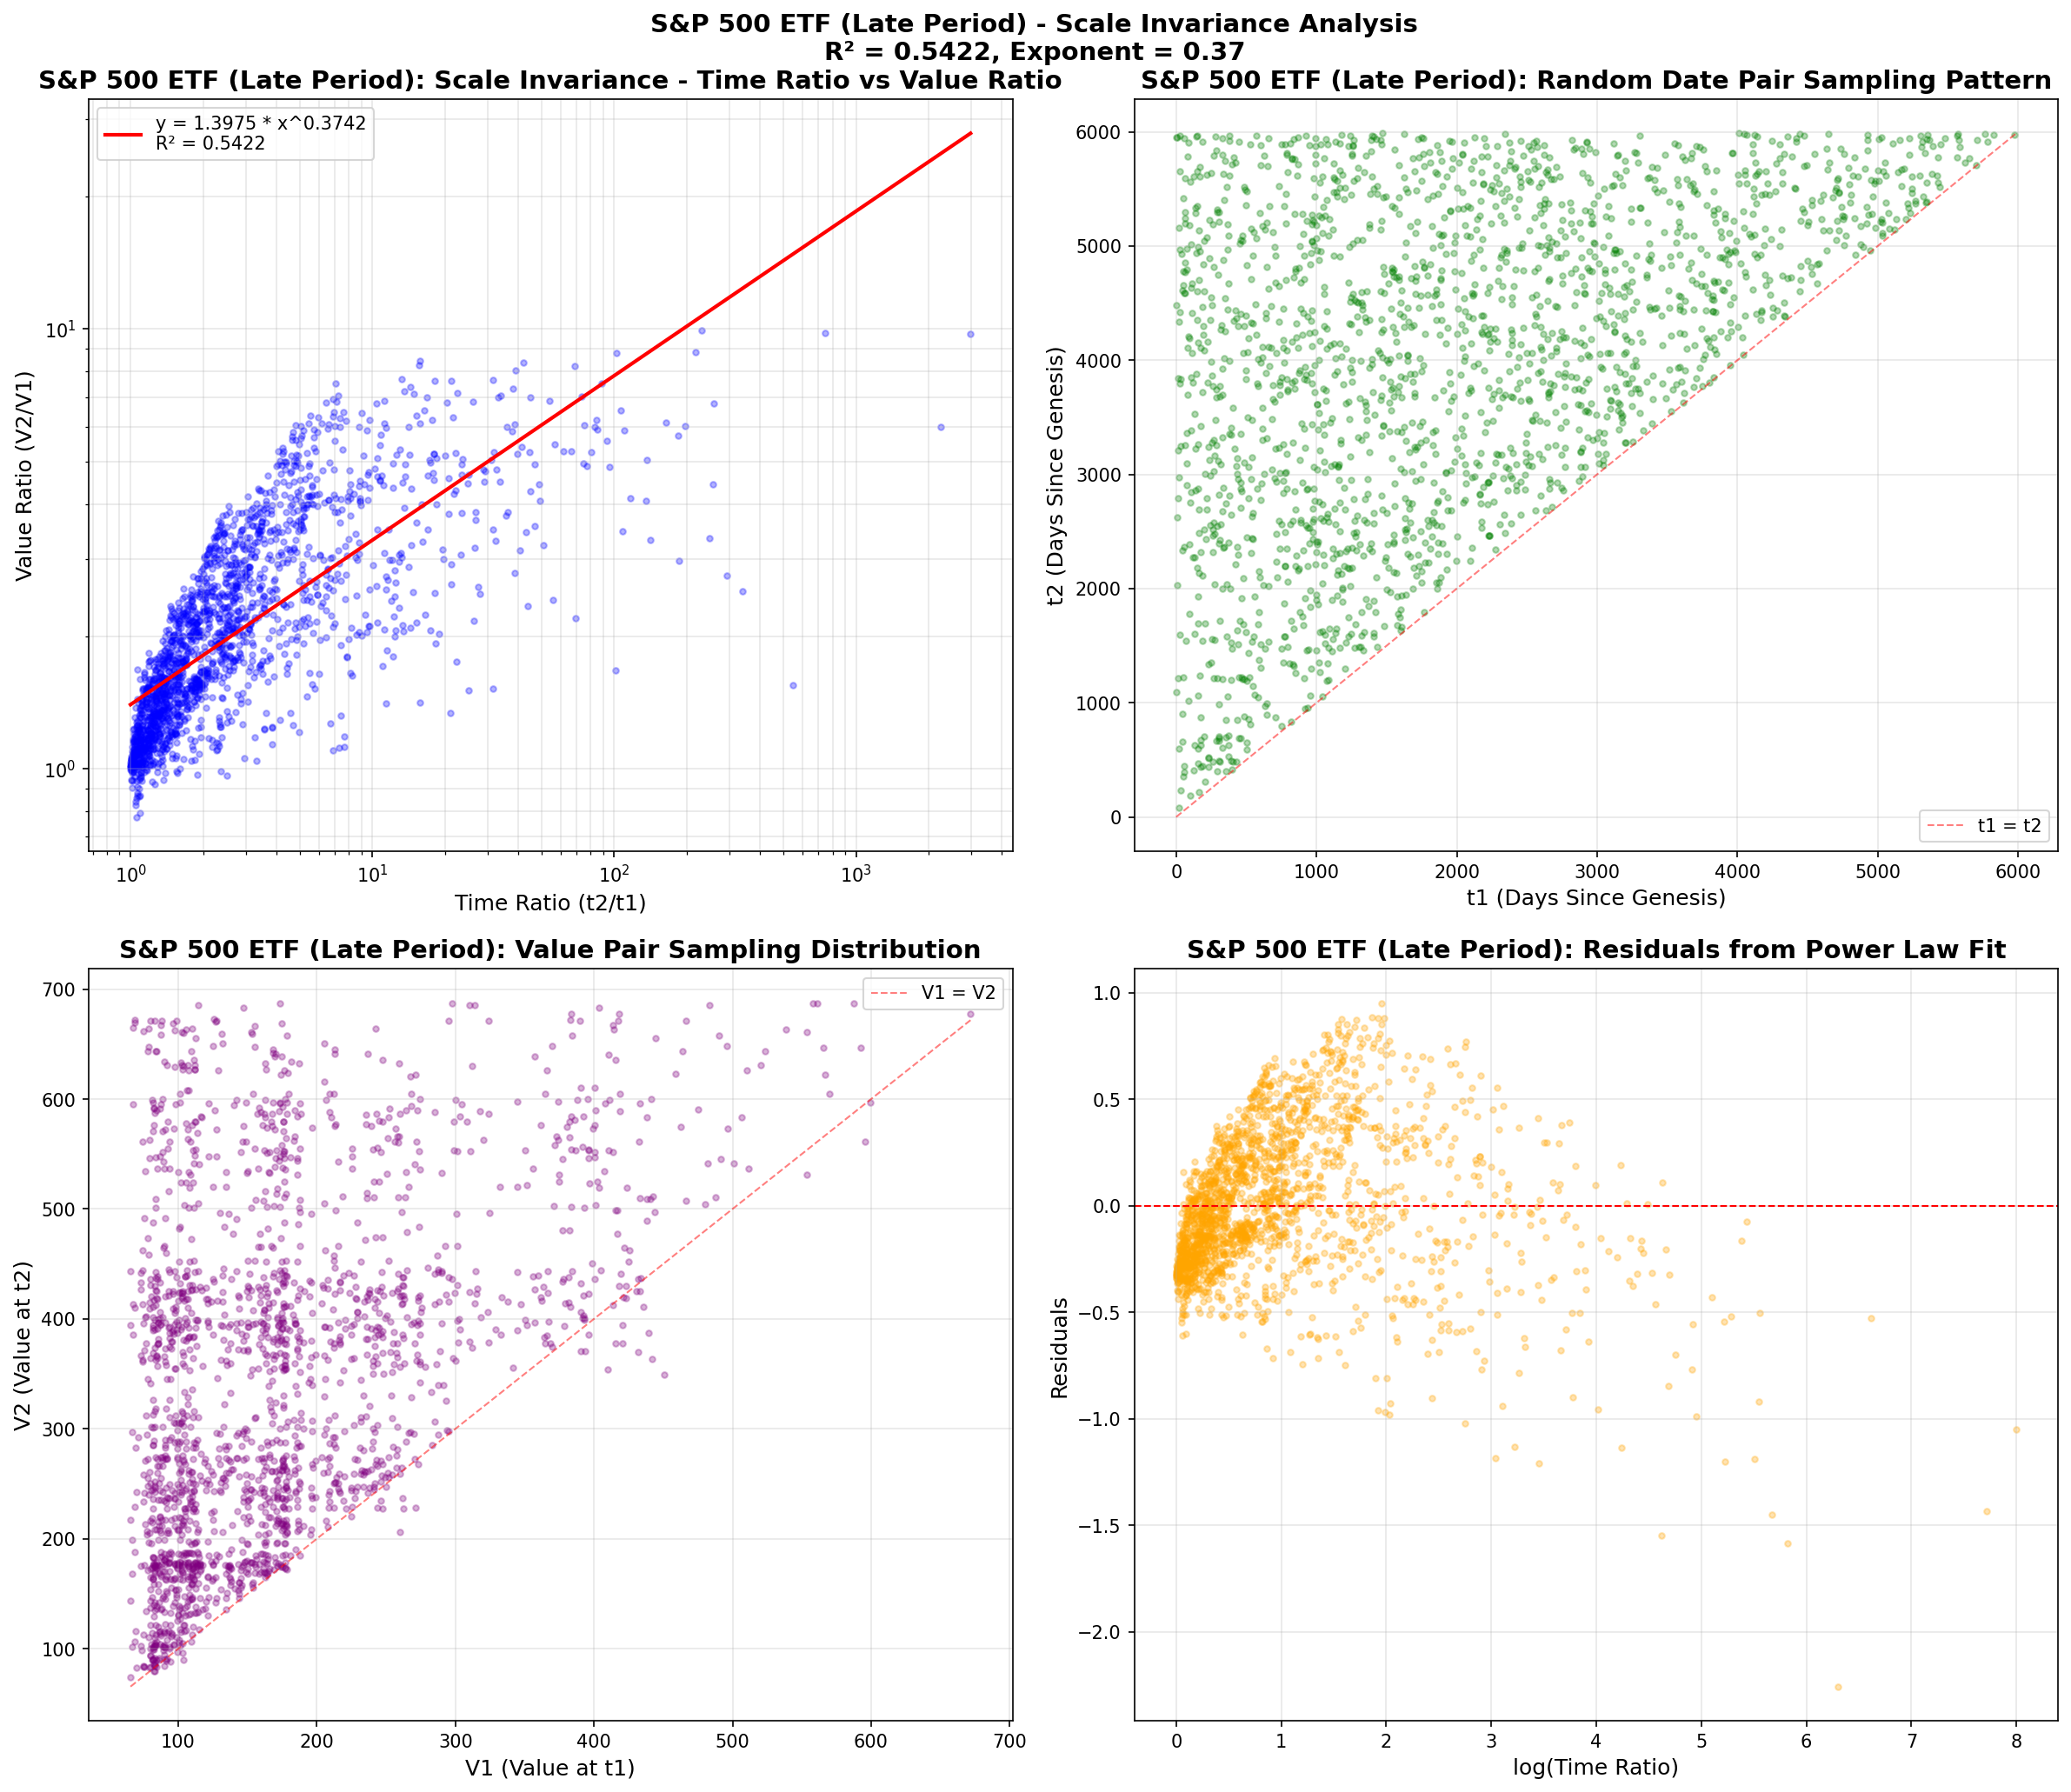
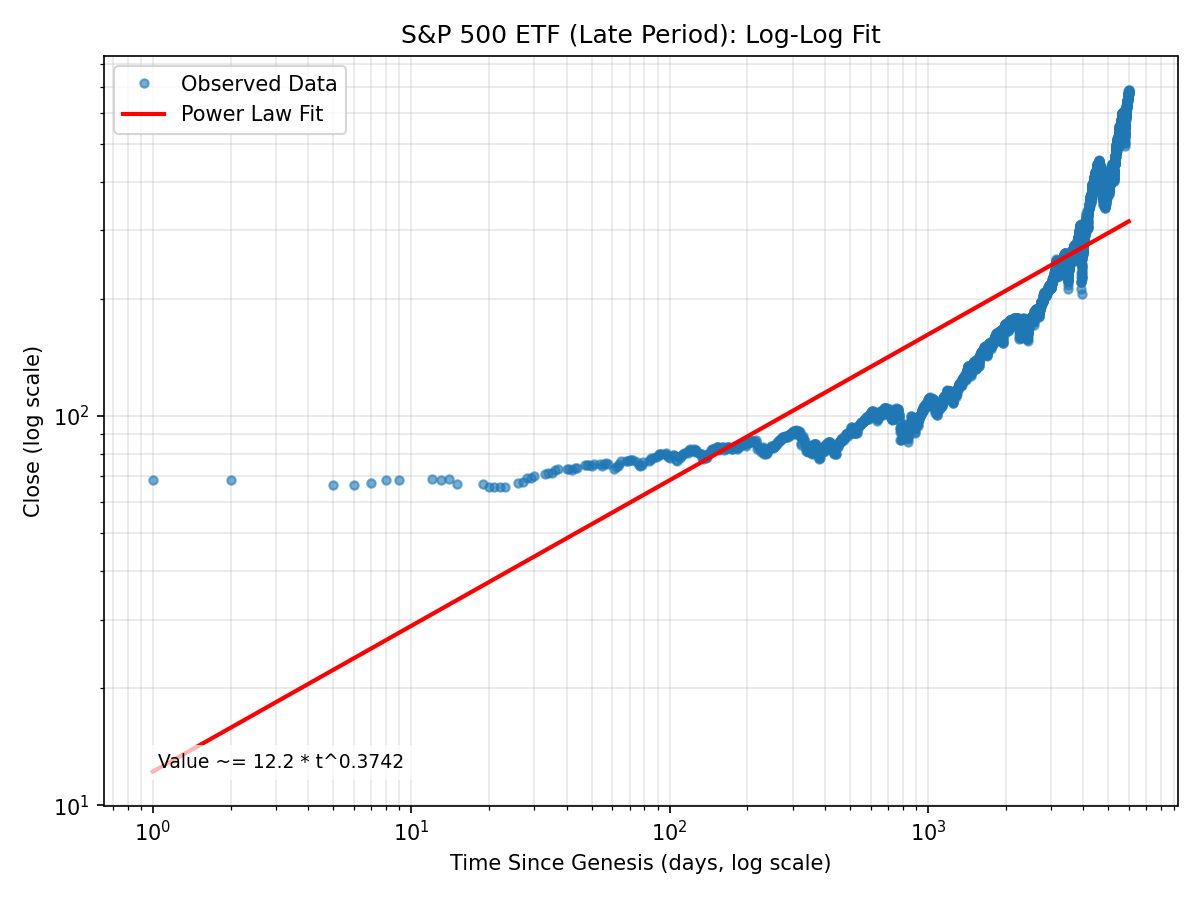
S&P 500 ETF (Late Period)
**R² (Scale Invariance):** 0.5422
**Power Law Exponent:** 0.37
**Data Points:** 4,126
**Date Range:** 2009-06-17 to 2025-11-07
**Log Residual Std Dev:** 0.3355
**Data Source:** Yahoo Finance API (yfinance Python library)
**Genesis Date:** 2009-06-17 (Hockey Stick Inflection)
**Power Law Fit:** Value ~= 12.2 * t^0.3742
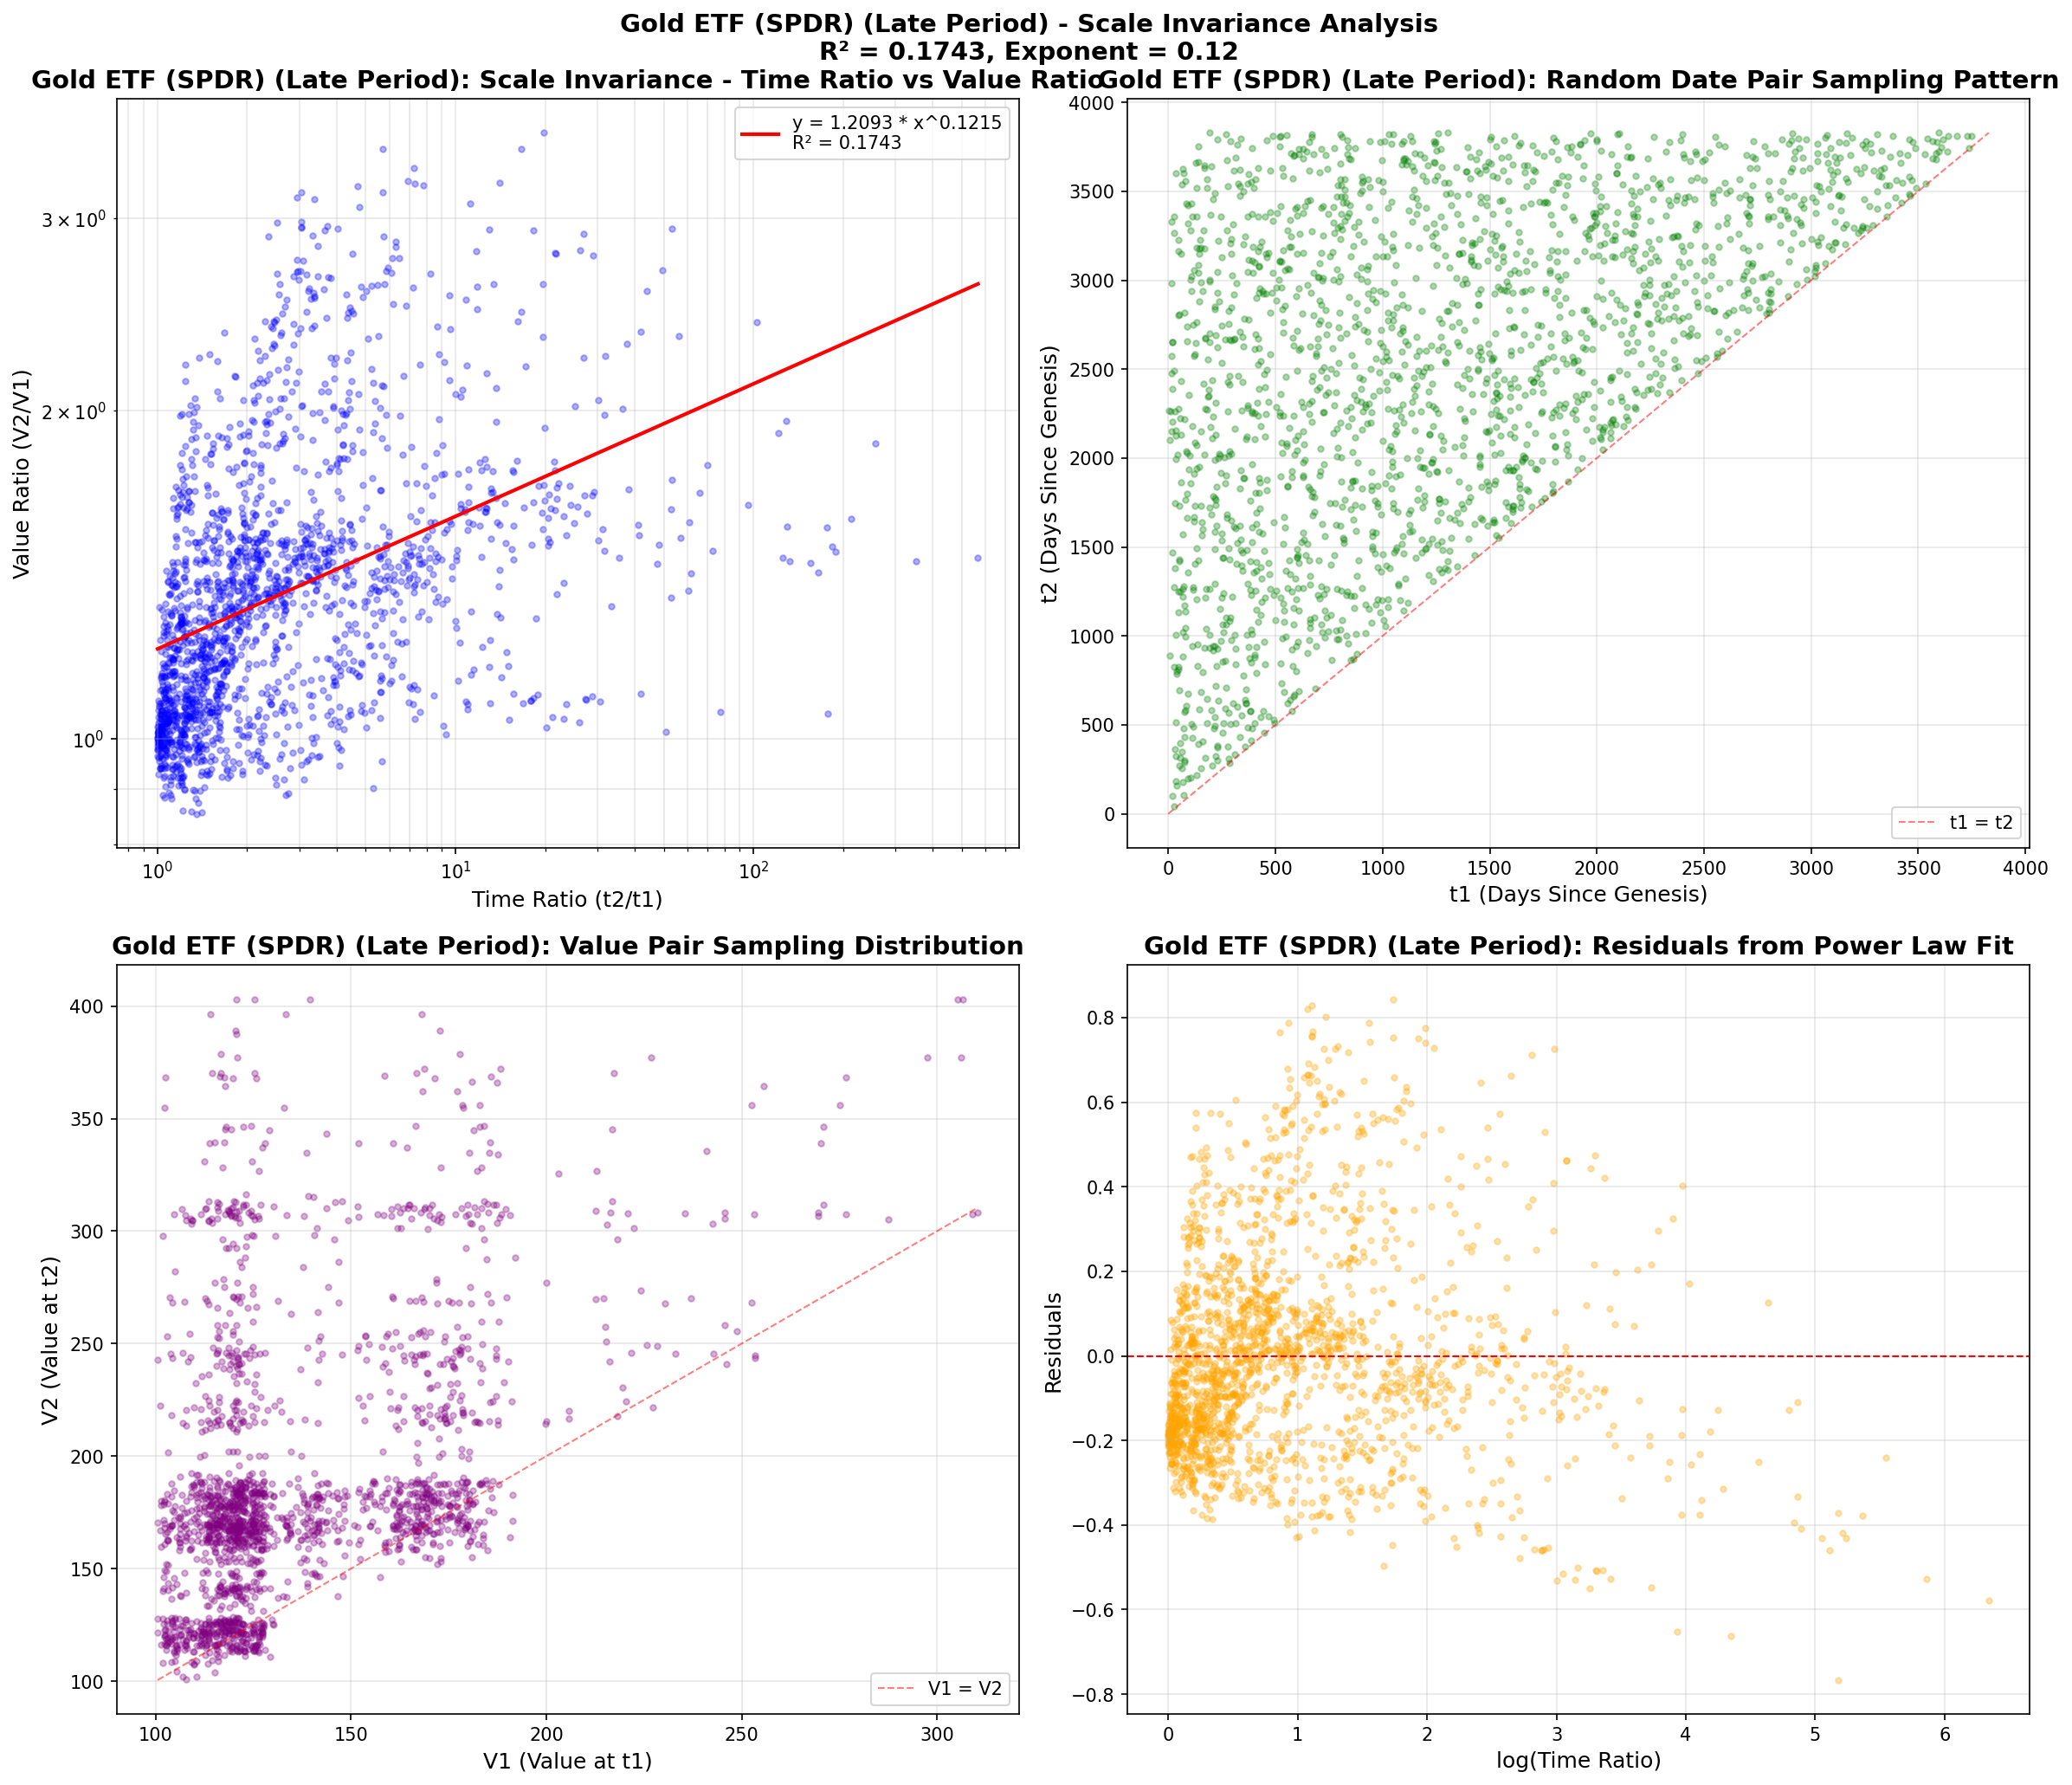
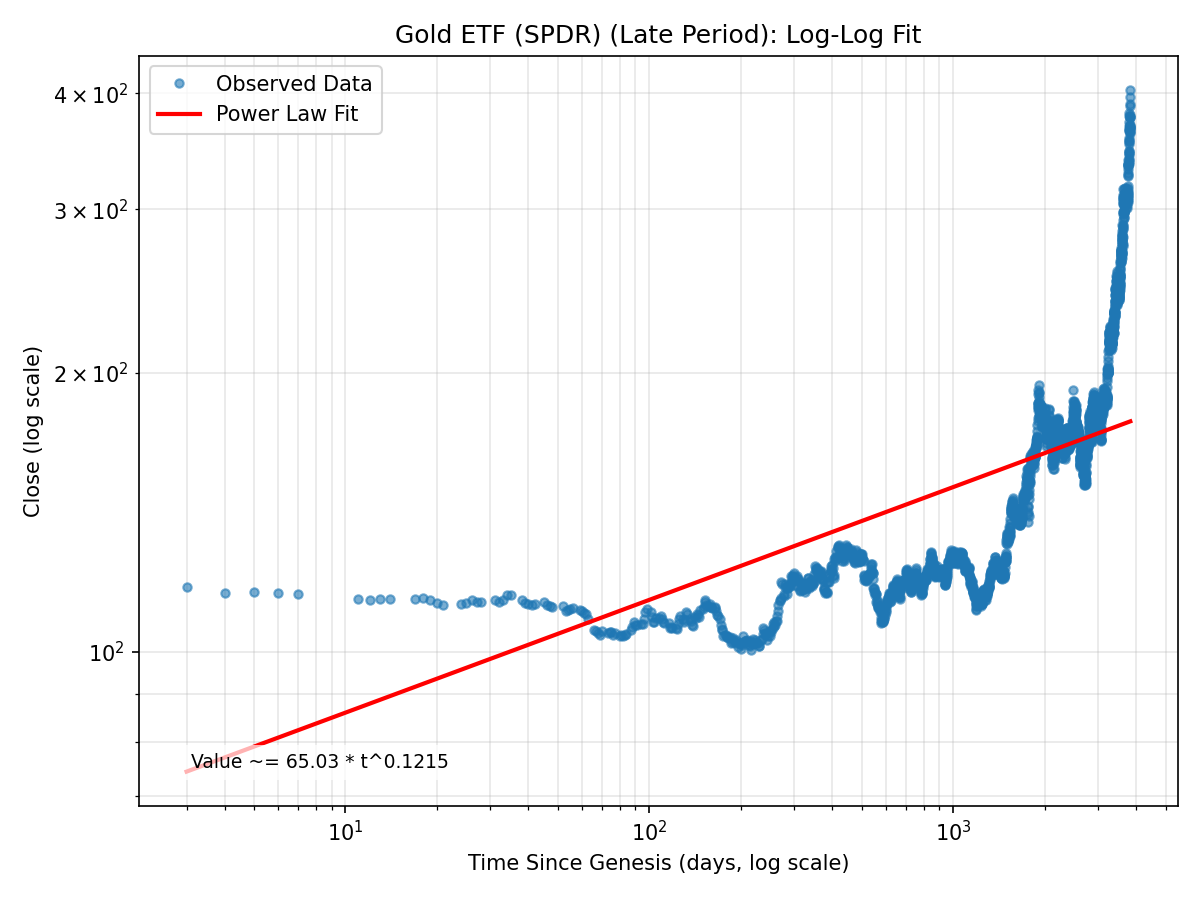
Gold ETF (SPDR) (Late Period)
**R² (Scale Invariance):** 0.1743
**Power Law Exponent:** 0.12
**Data Points:** 2,638
**Date Range:** 2015-05-15 to 2025-11-07
**Log Residual Std Dev:** 0.2204
**Data Source:** Yahoo Finance API (yfinance Python library)
**Genesis Date:** 2015-05-15 (Hockey Stick Inflection)
**Power Law Fit:** Value ~= 65.03 * t^0.1215
Health
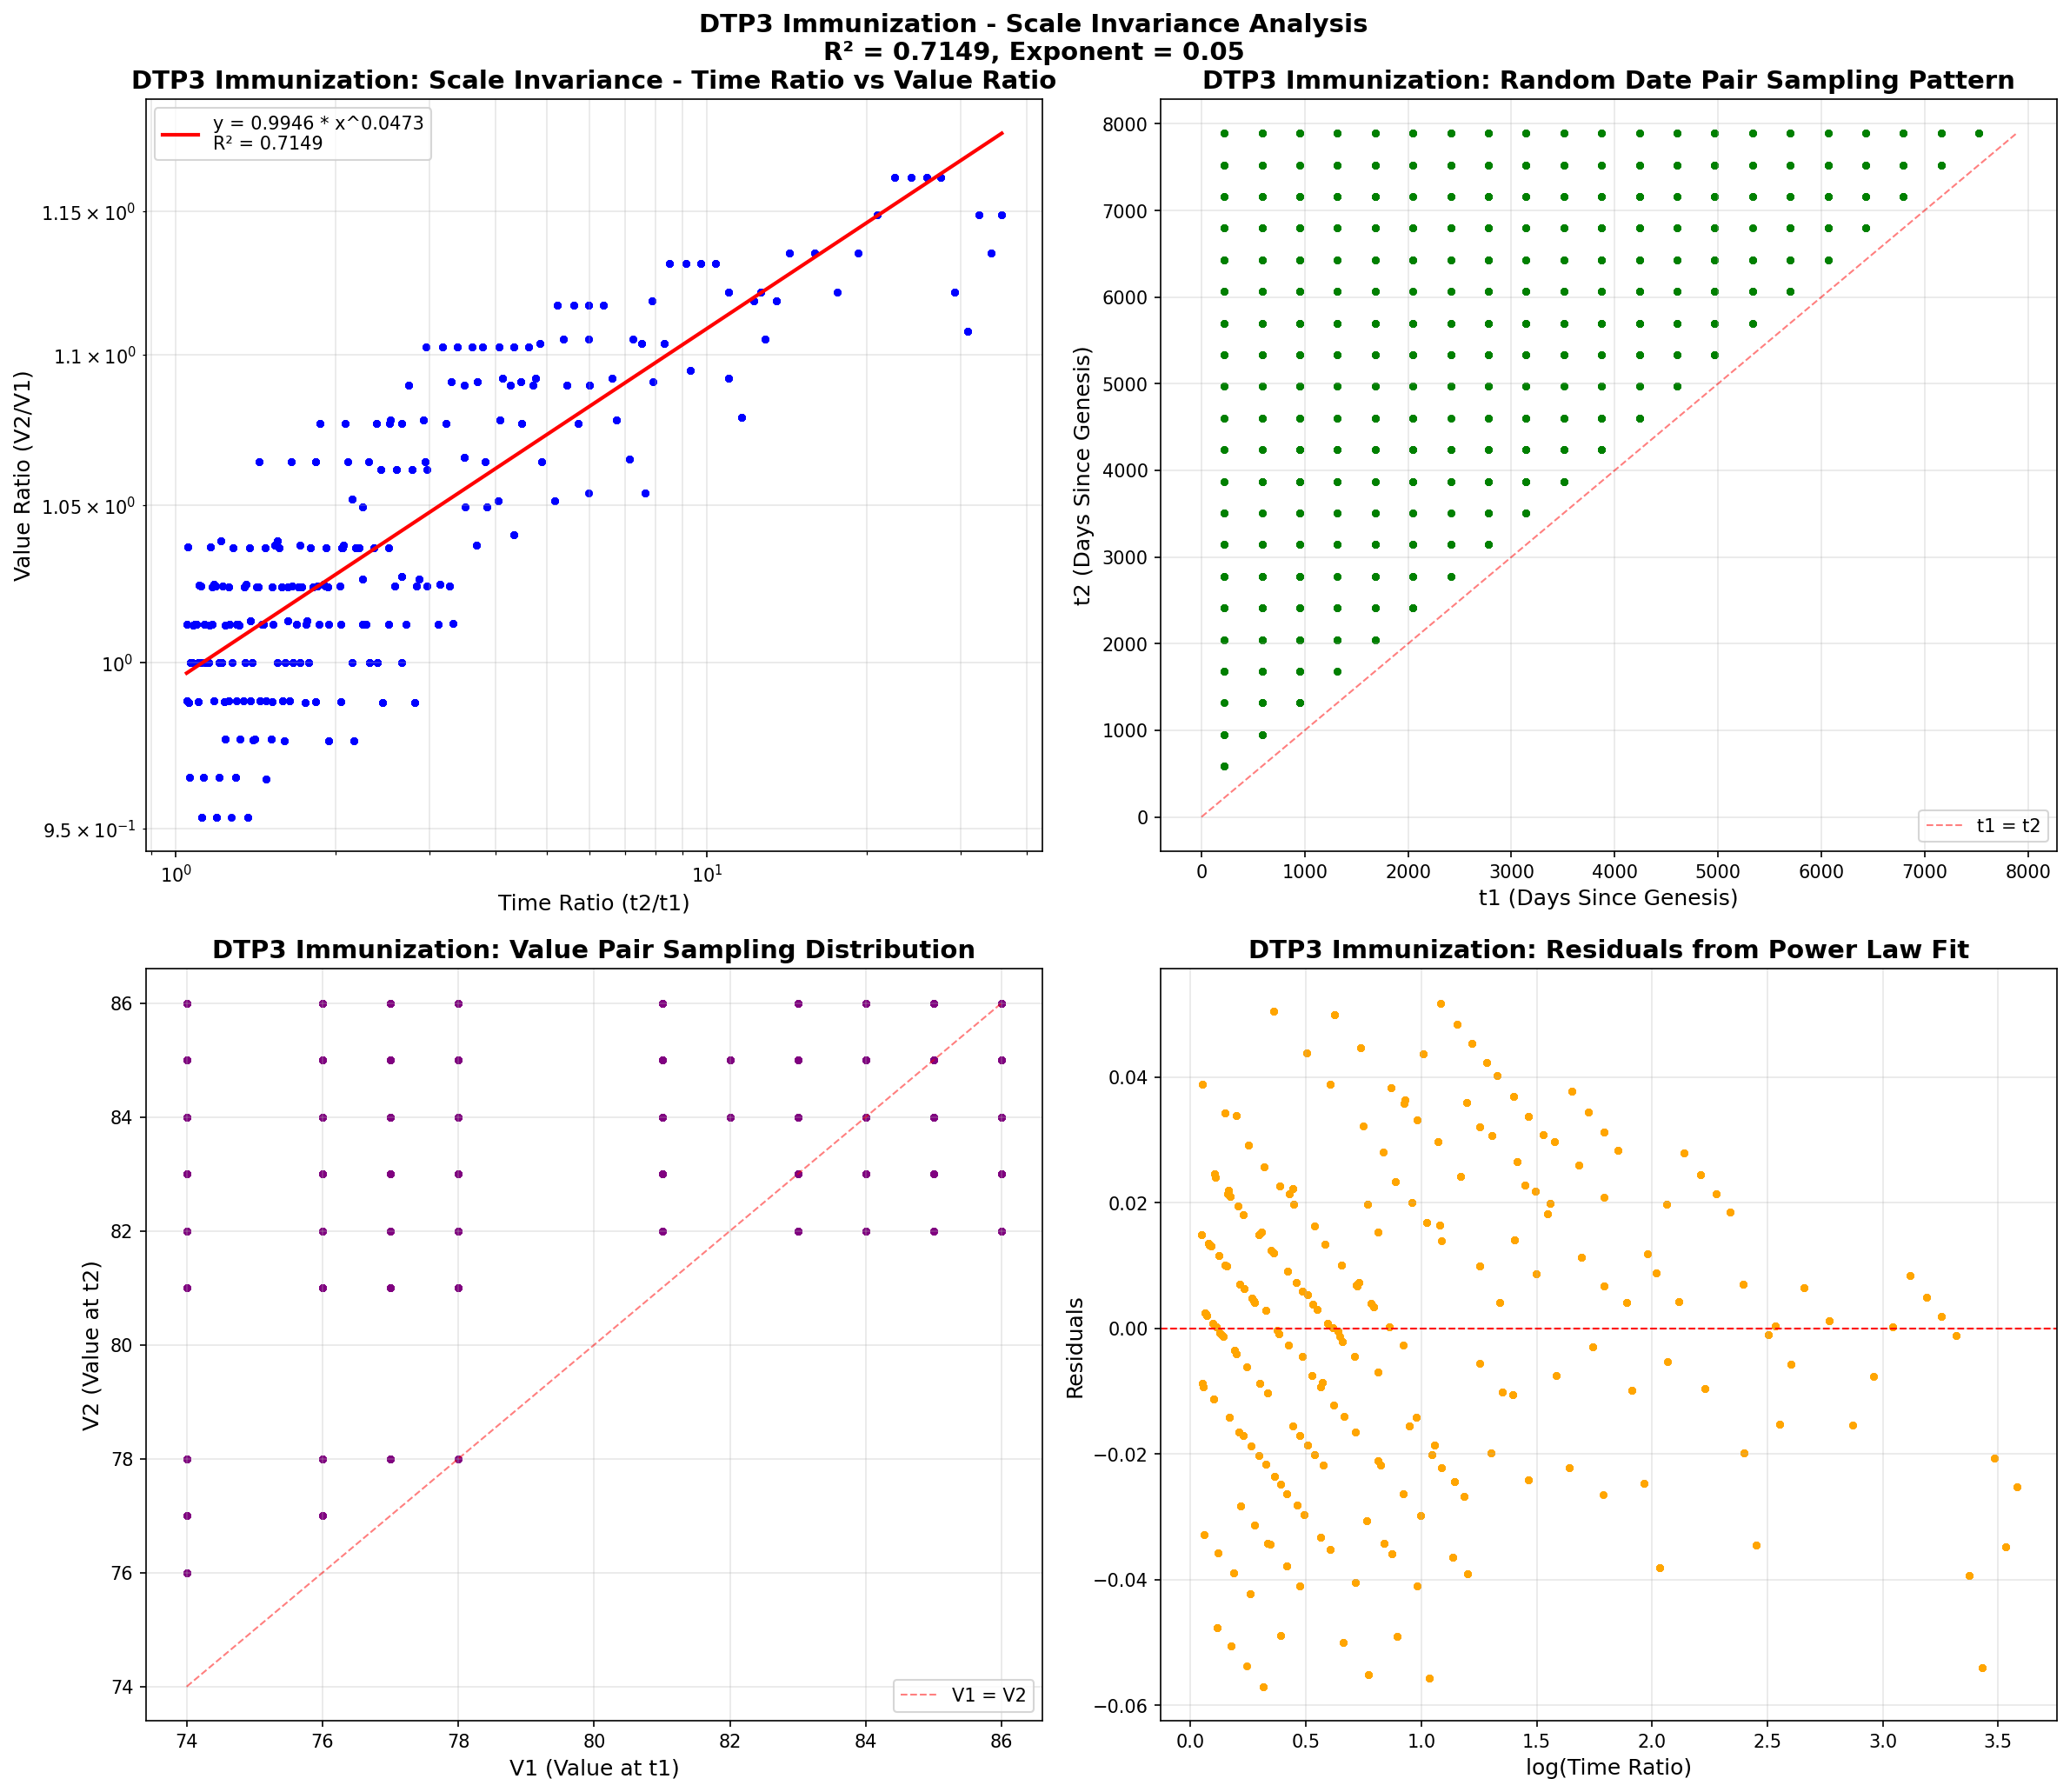
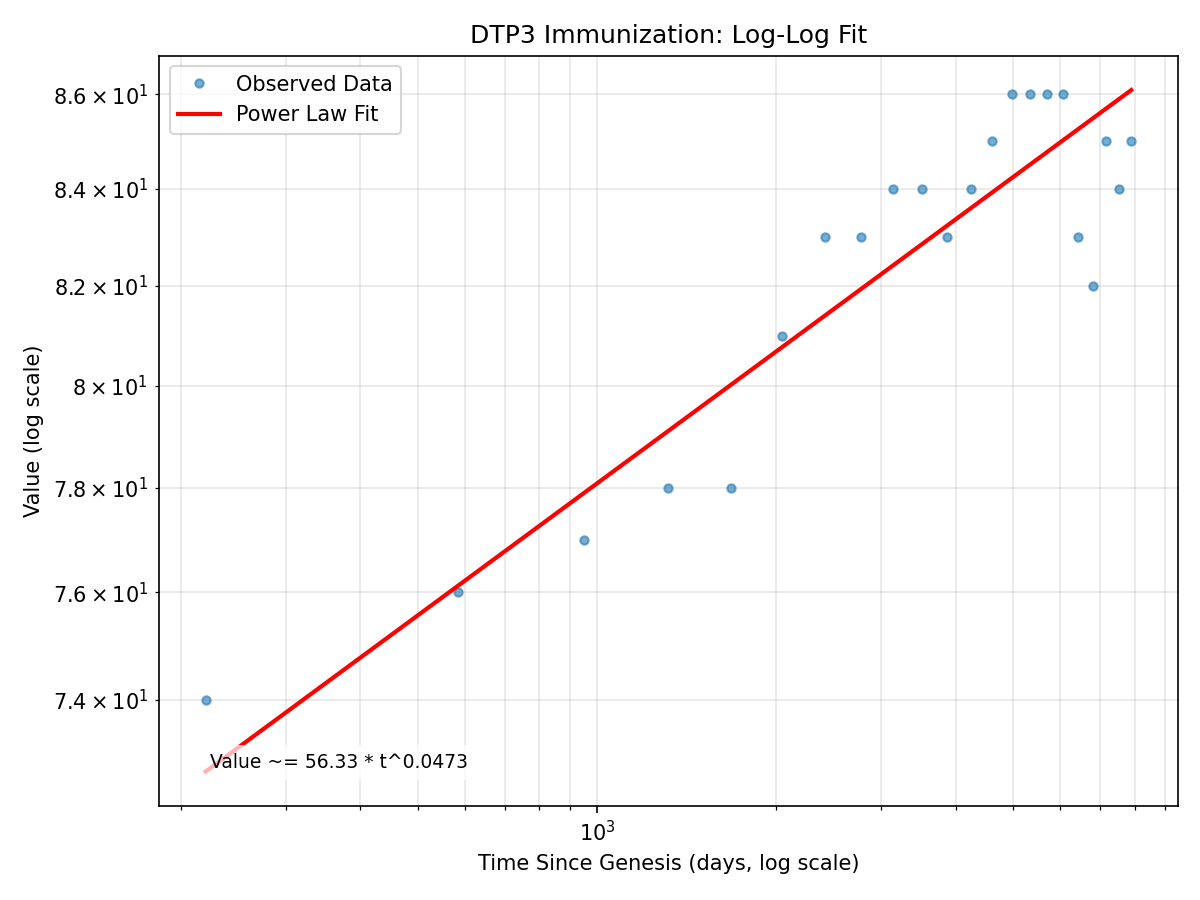
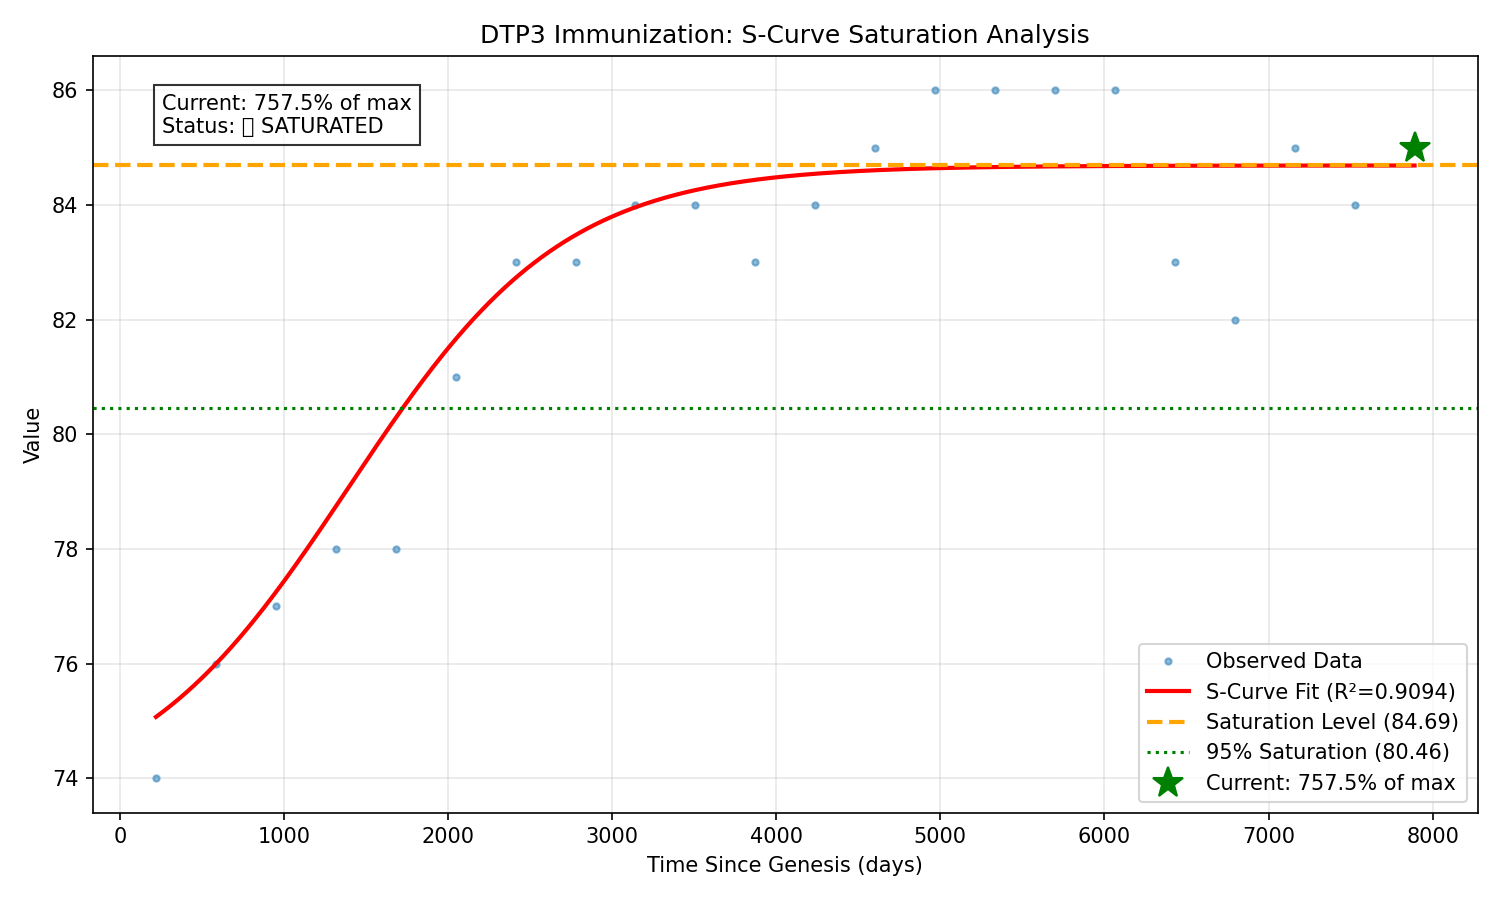
DTP3 Immunization
**R² (Scale Invariance):** 0.7149
**Power Law Exponent:** 0.05
**Data Points:** 22
**Date Range:** 2003-01-01 to 2024-01-01
**Log Residual Std Dev:** 0.0177
**Data Source:** WHO API (WHS4_100)
**Genesis Date:** 2002-05-26 (Optimized vs published)
**Power Law Fit:** Value ~= 56.33 * t^0.0473
Saturation Analysis (S-Curve Detection):
**📈 S-CURVE DETECTED** (Sigmoid R² = 0.9094 vs Linear R² = 0.6163)
**Current Progress:** 757.5% of estimated maximum
**Saturation Level:** 1.12e+01 (estimated carrying capacity)
**✅ HAS REACHED SATURATION** (≥95% of maximum)
**Growth Pattern:** Decelerating (17.9% slowdown in recent period)
Genesis Date Optimization:
**Optimal Genesis:** 2002-05-26 (R² = 0.7195)
**Note:** No published genesis date available for comparison
**Tested:** 11 candidate dates across range 2002-05-26 to 2004-11-11
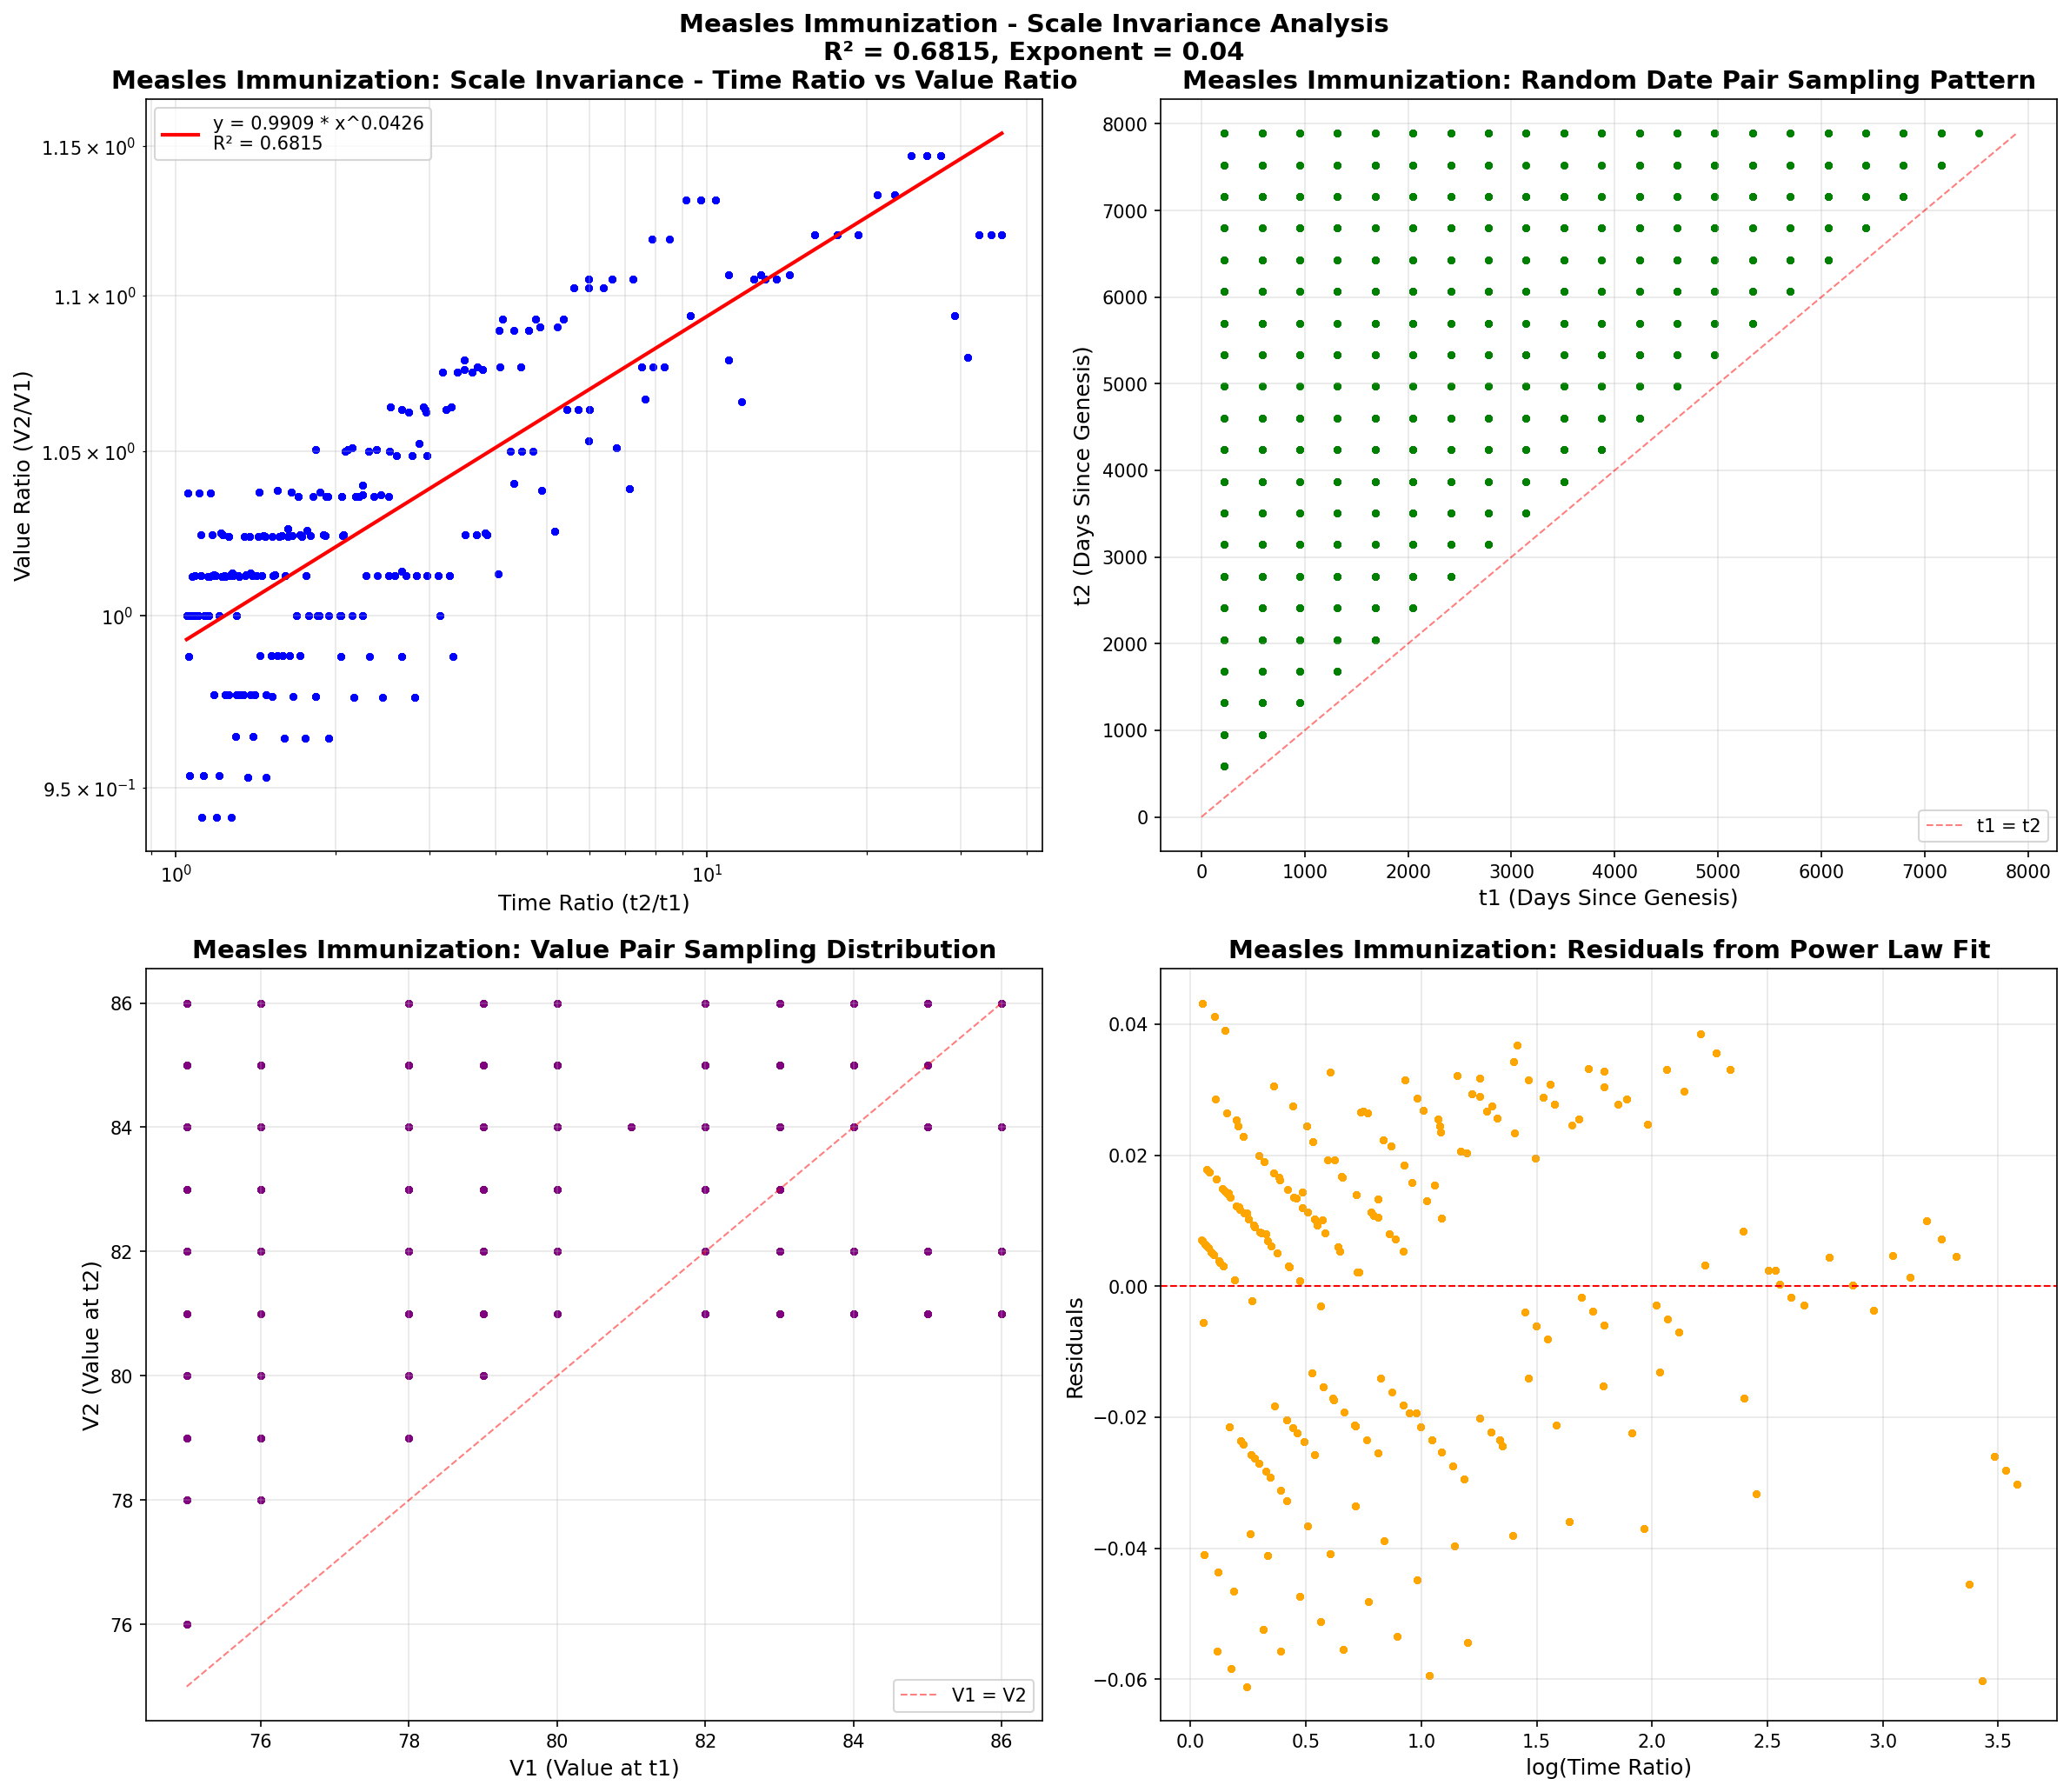
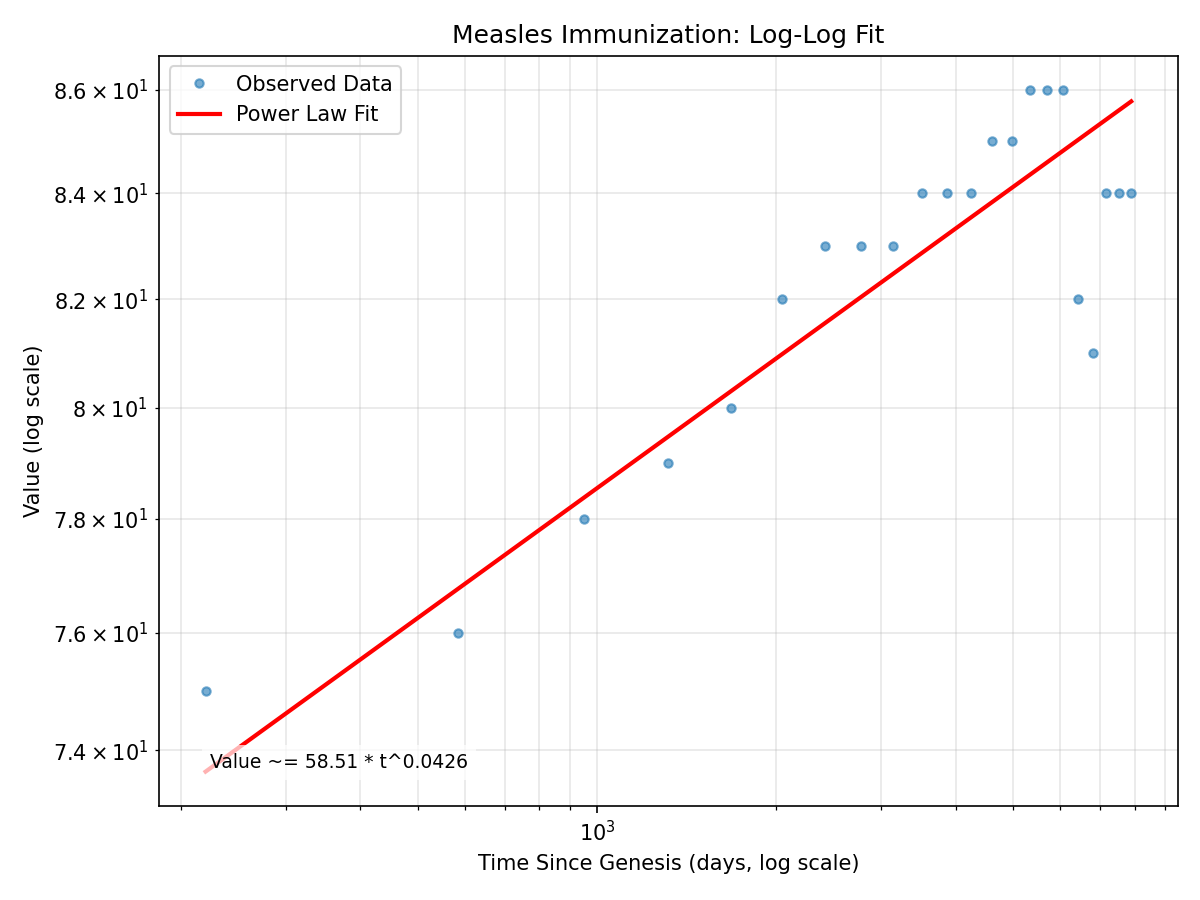
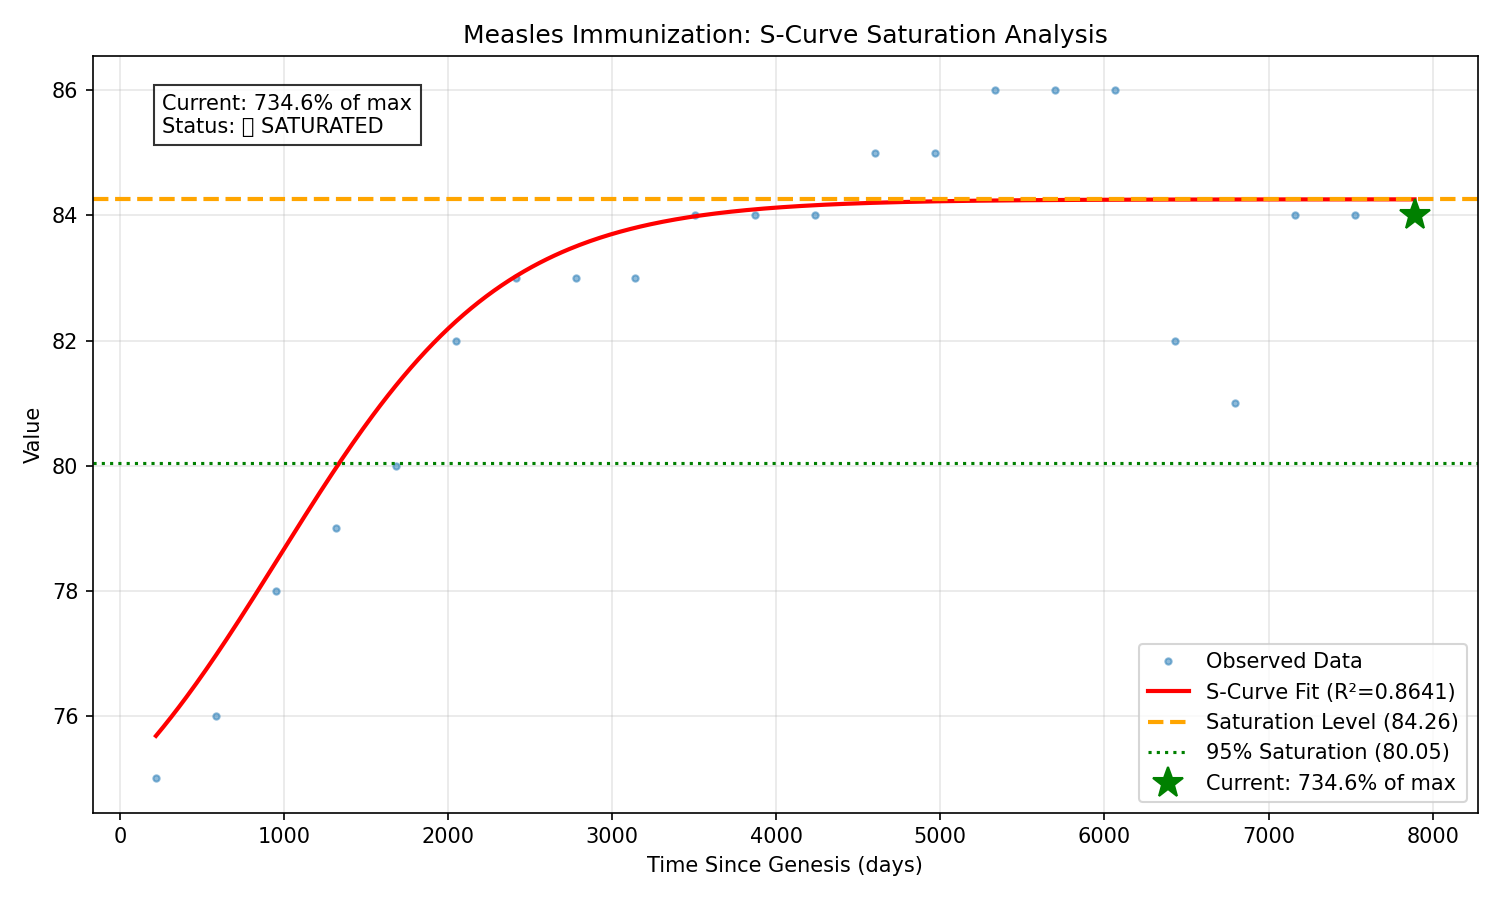
Measles Immunization
**R² (Scale Invariance):** 0.6815
**Power Law Exponent:** 0.04
**Data Points:** 22
**Date Range:** 2003-01-01 to 2024-01-01
**Log Residual Std Dev:** 0.0186
**Data Source:** WHO API (WHS4_544)
**Genesis Date:** 2002-05-26 (Optimized vs published)
**Power Law Fit:** Value ~= 58.51 * t^0.0426
Saturation Analysis (S-Curve Detection):
**📈 S-CURVE DETECTED** (Sigmoid R² = 0.8641 vs Linear R² = 0.5063)
**Current Progress:** 734.6% of estimated maximum
**Saturation Level:** 1.14e+01 (estimated carrying capacity)
**✅ HAS REACHED SATURATION** (≥95% of maximum)
**Growth Pattern:** Decelerating (-7.8% slowdown in recent period)
Genesis Date Optimization:
**Optimal Genesis:** 2002-05-26 (R² = 0.6767)
**Note:** No published genesis date available for comparison
**Tested:** 11 candidate dates across range 2002-05-26 to 2004-11-11
Infrastructure
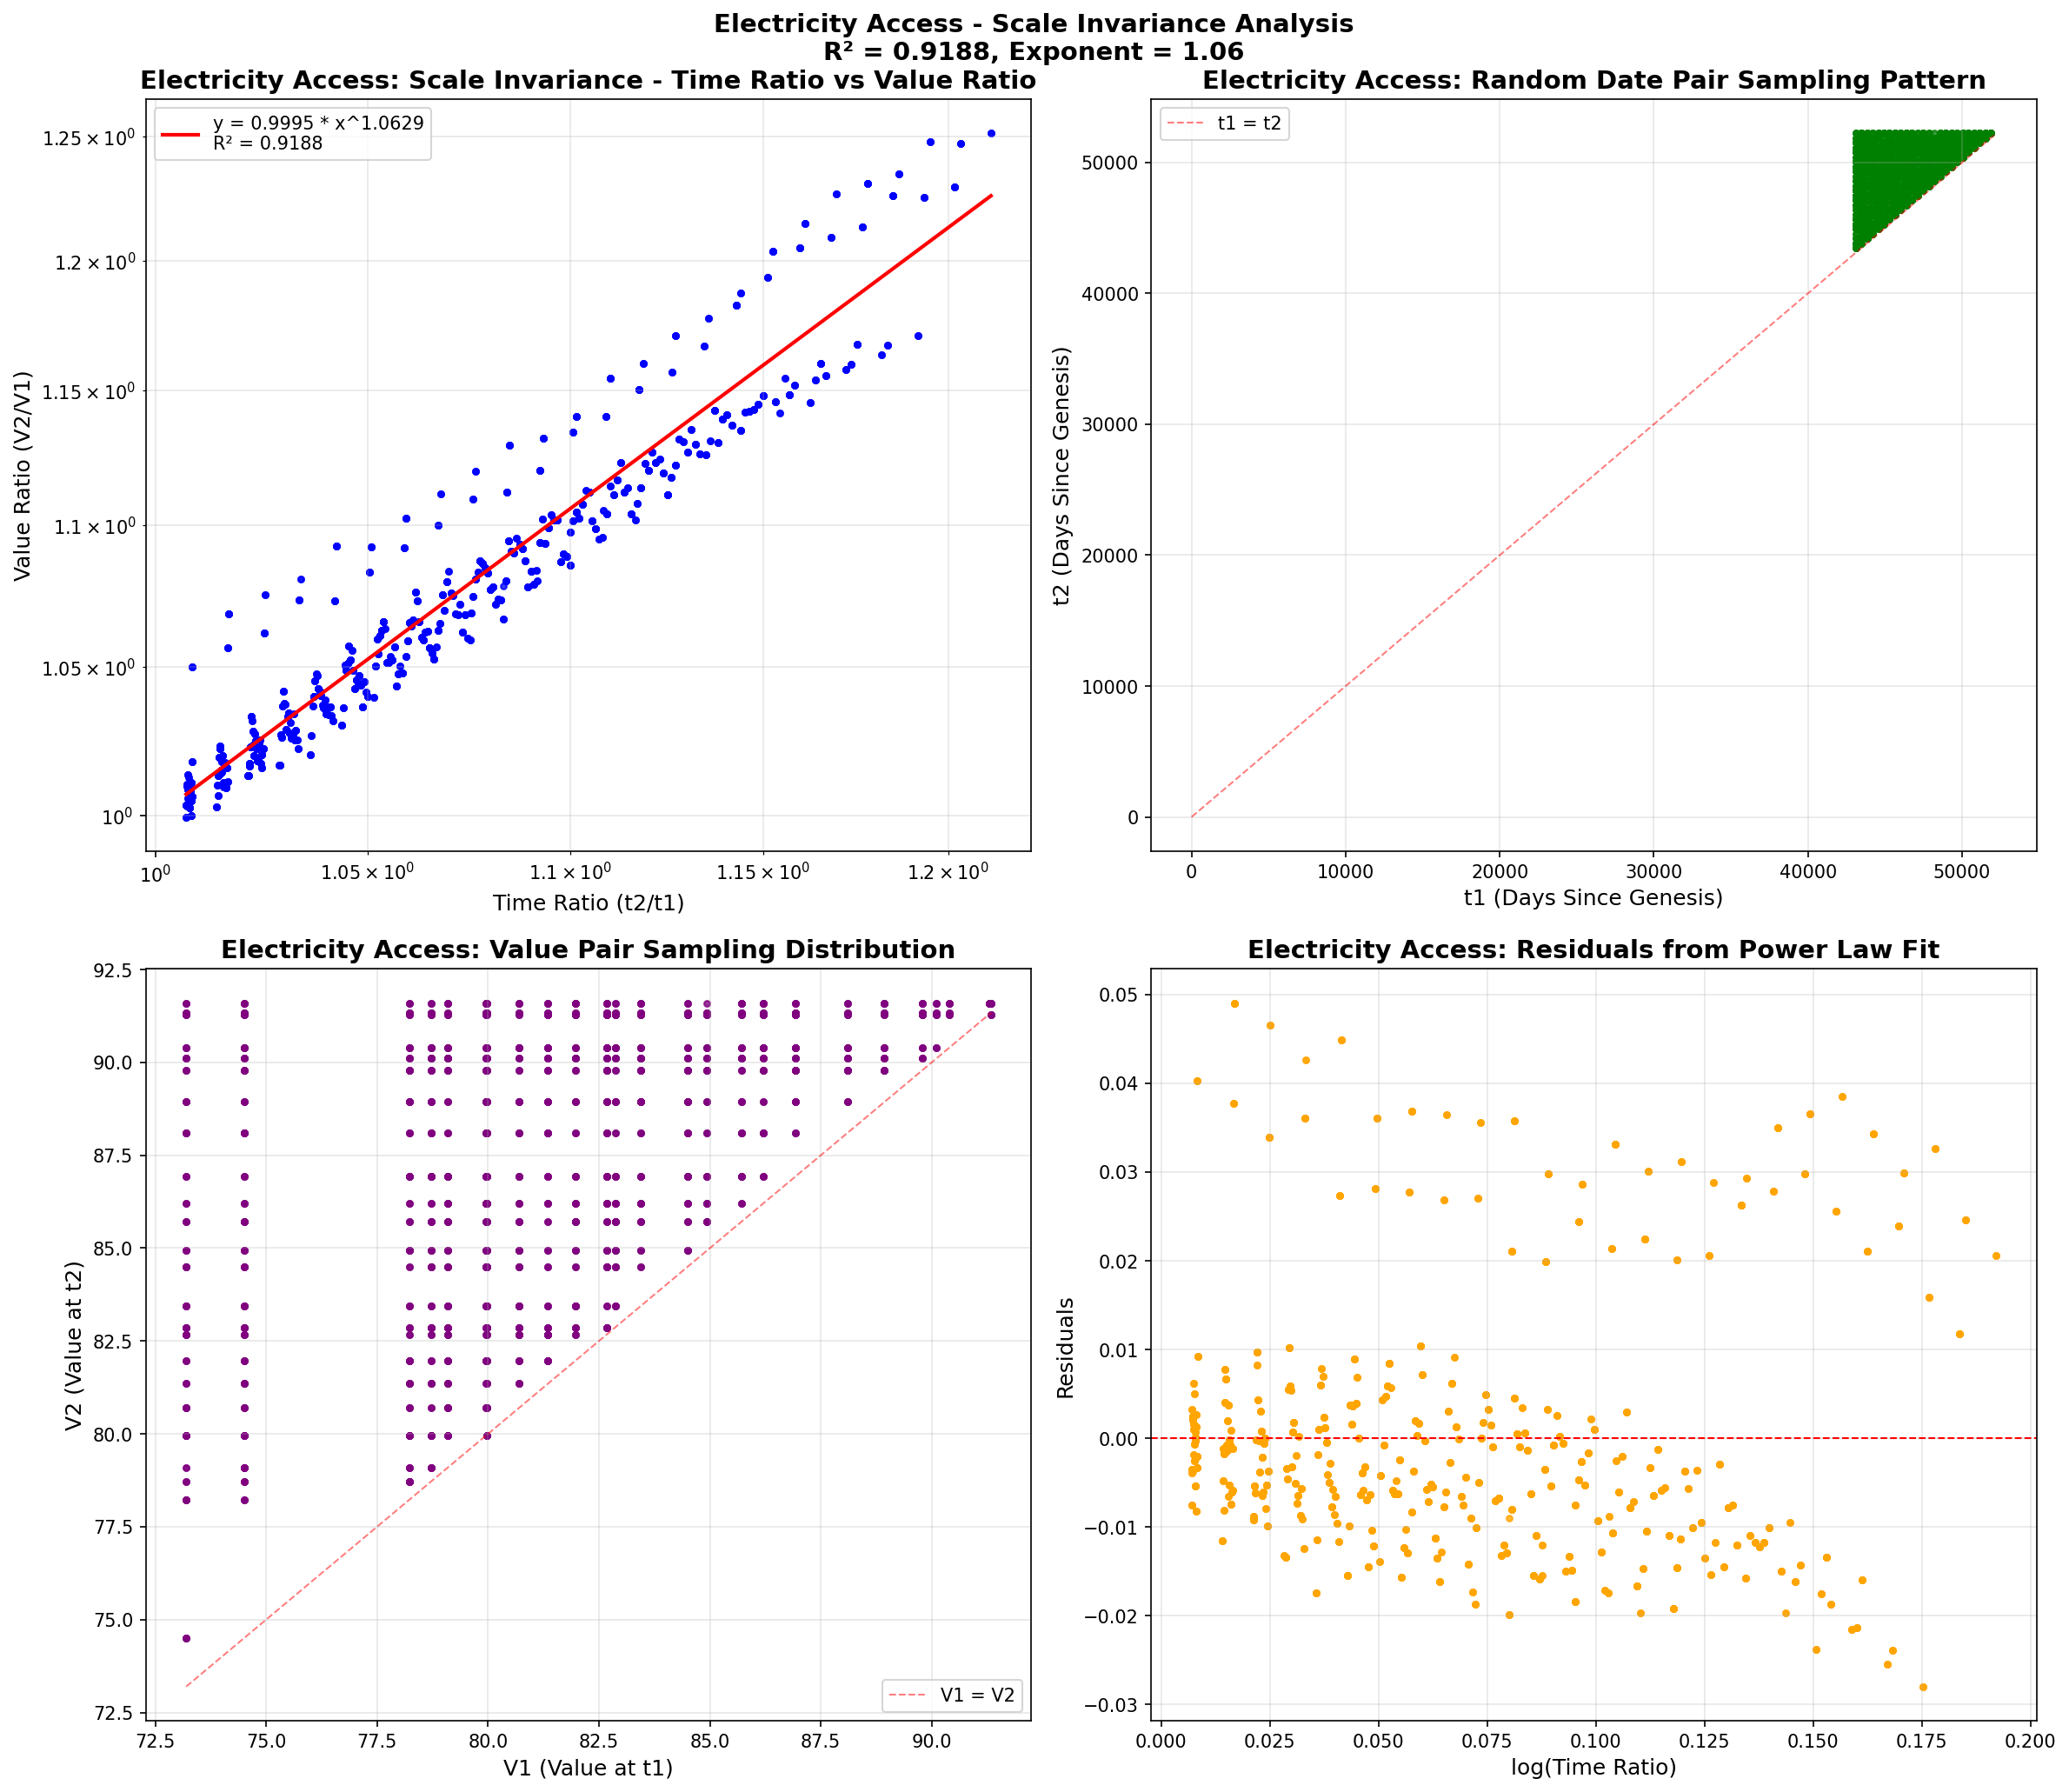
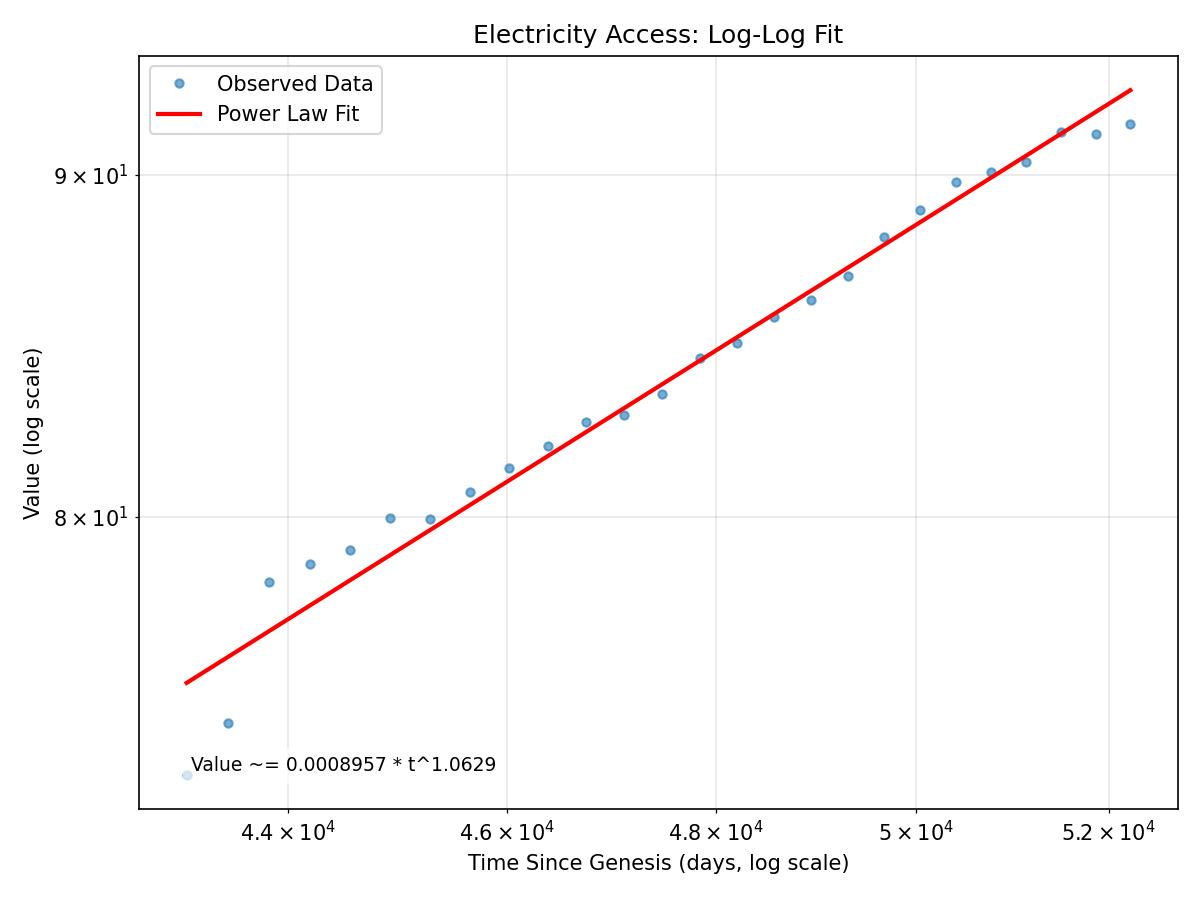
Electricity Access
**R² (Scale Invariance):** 0.9188
**Power Law Exponent:** 1.06
**Data Points:** 26
**Date Range:** 1998-01-01 to 2023-01-01
**Log Residual Std Dev:** 0.0102
**Data Source:** World Bank API (EG.ELC.ACCS.ZS)
**Genesis Date:** 1880-01-01 (Provided)
**Power Law Fit:** Value ~= 0.0008957 * t^1.0629
Saturation Analysis (S-Curve Detection):
**⚡ POWER-LAW GROWTH** (Not saturating)
**Sigmoid R²:** 0.9805 vs Linear R²: 0.9766
**Current Value:** 0.5% of sigmoid model maximum
**Assessment:** No evidence of saturation or S-curve behavior
Technology
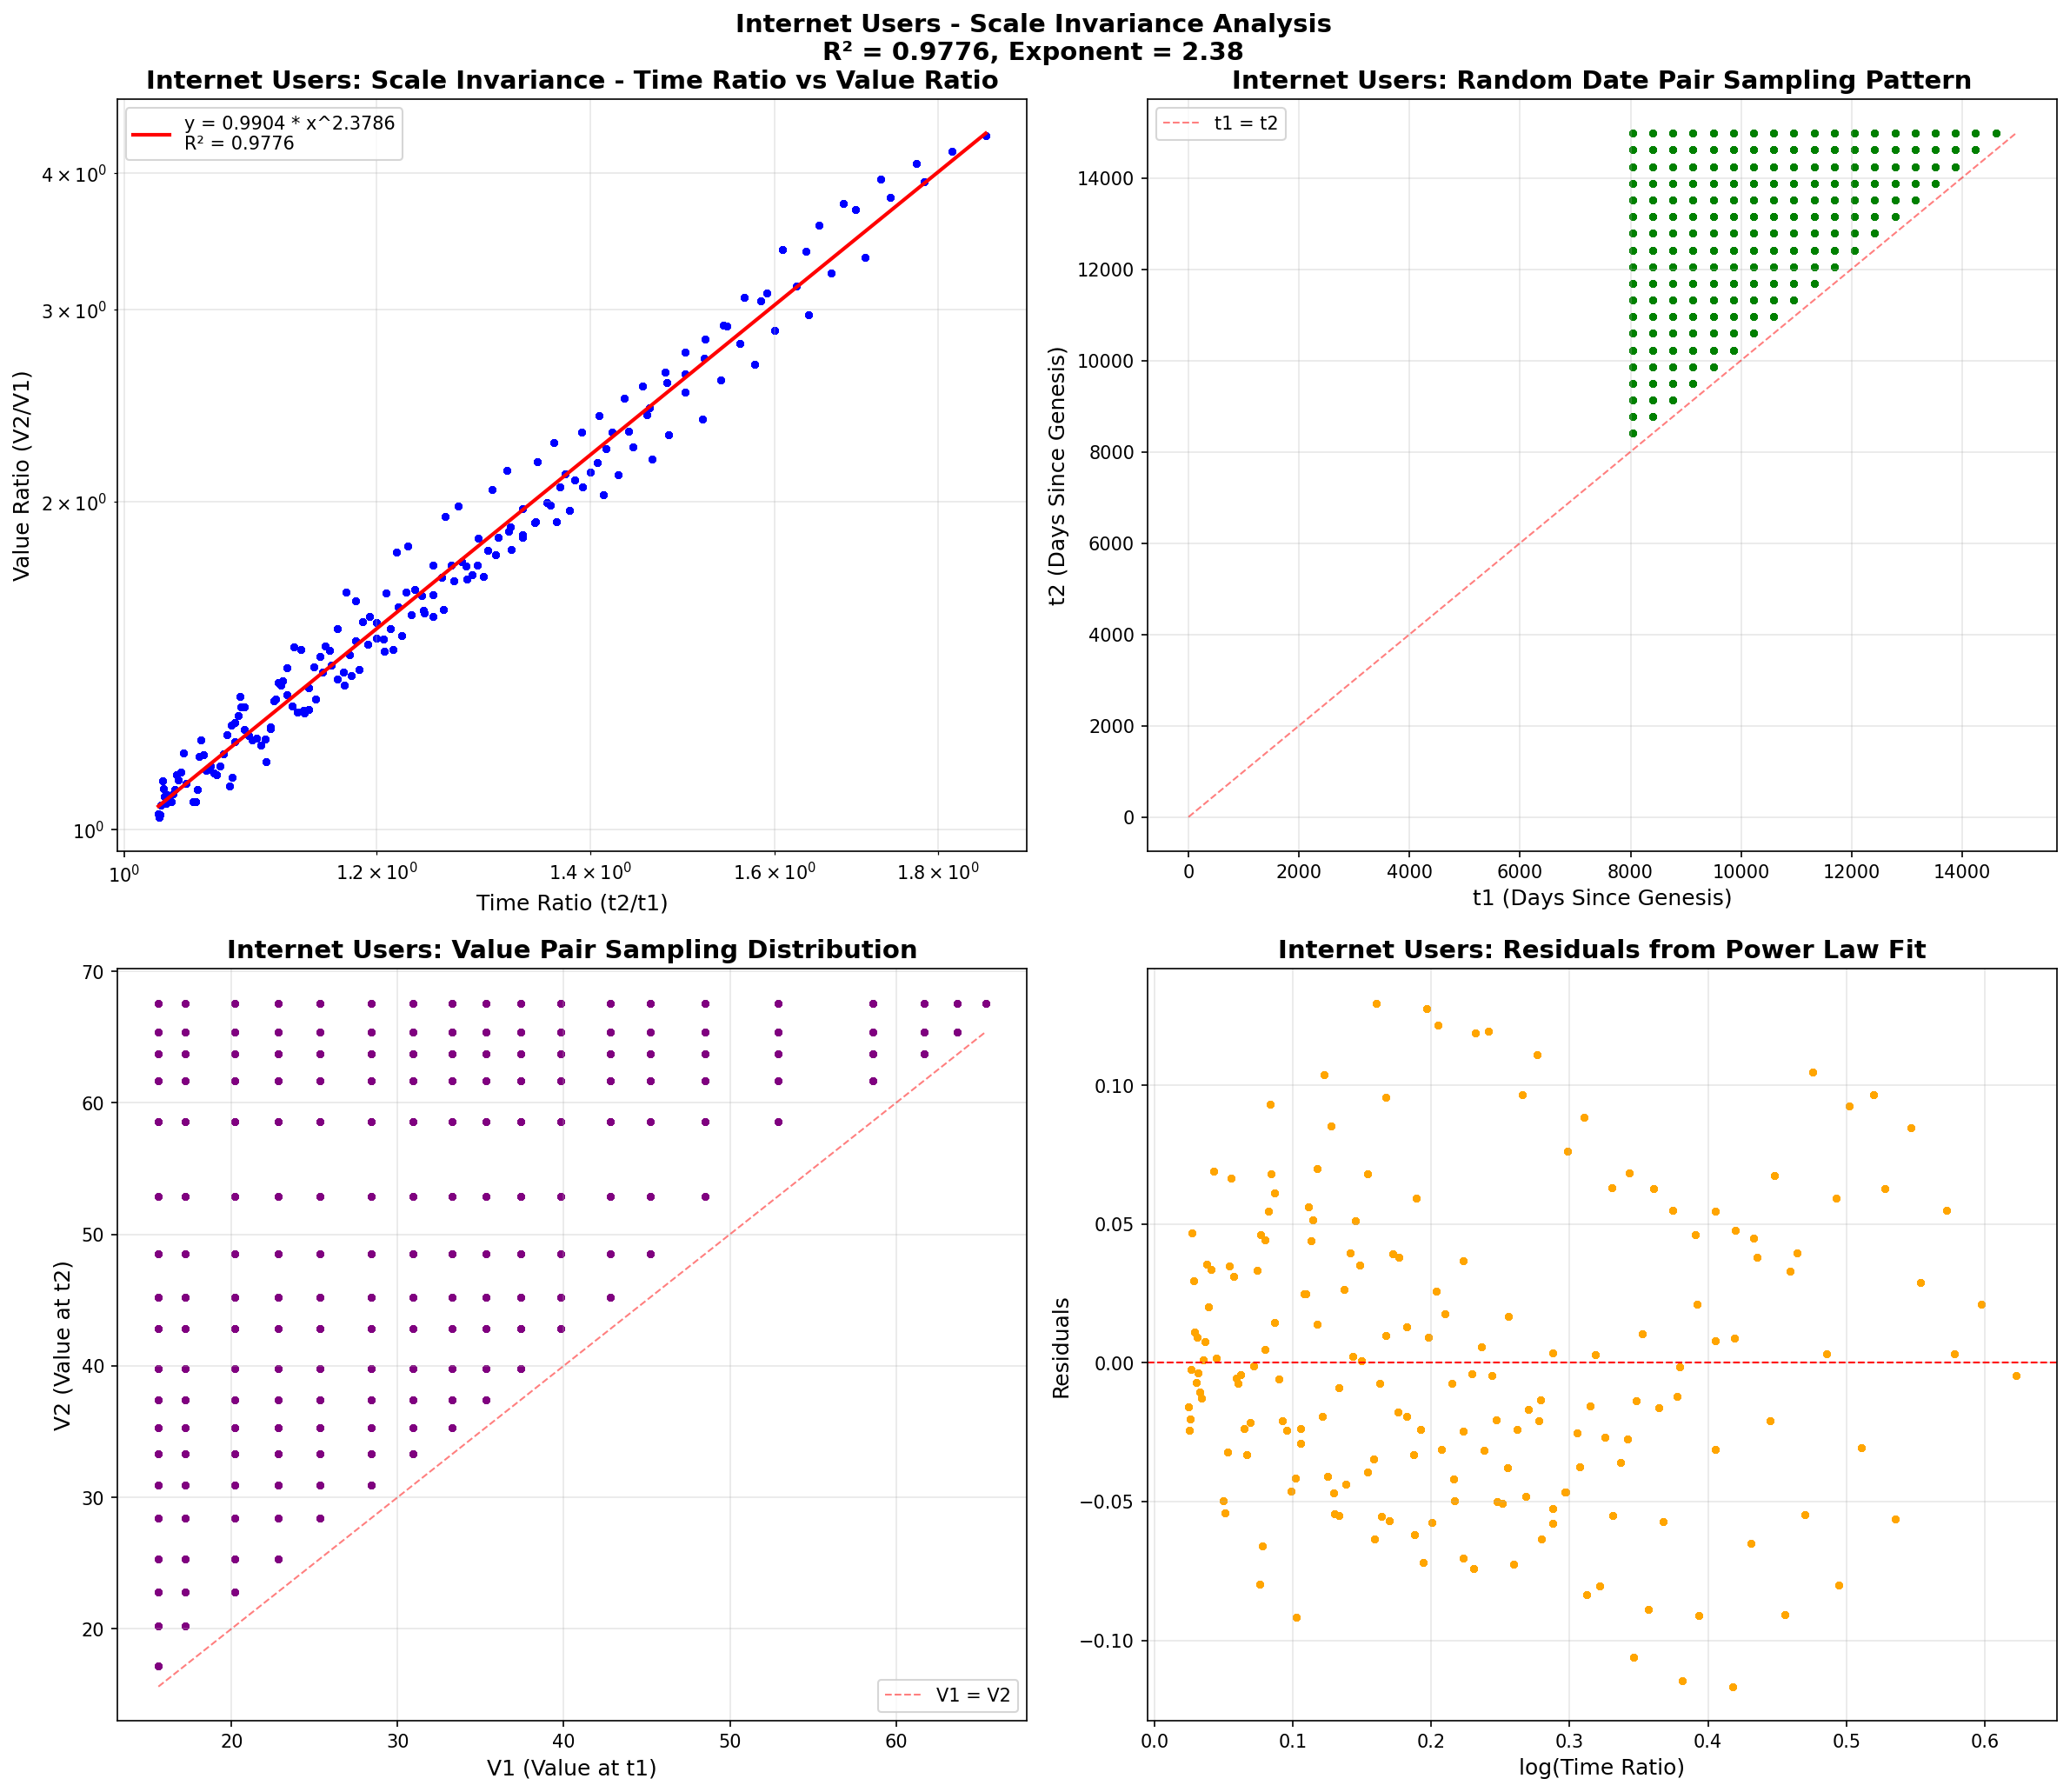
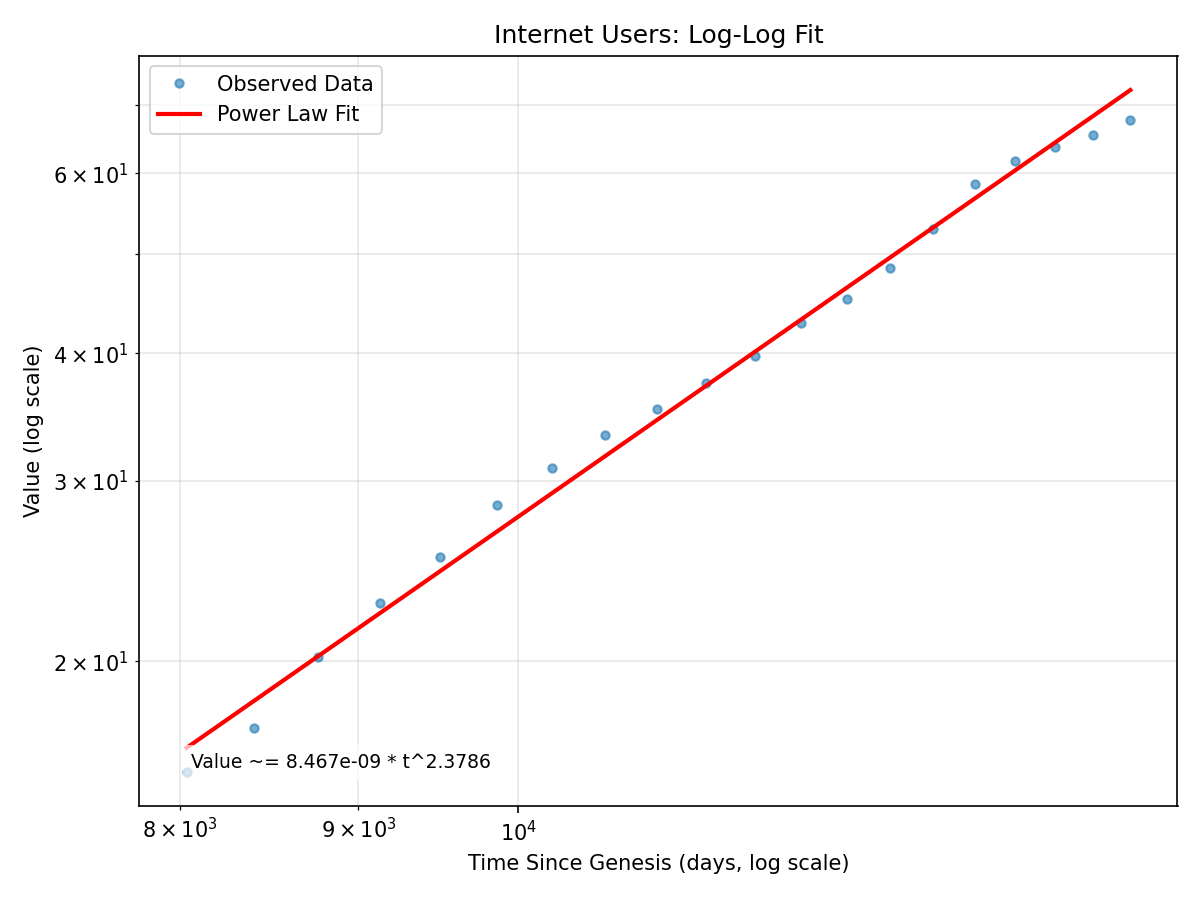
Internet Users
**R² (Scale Invariance):** 0.9776
**Power Law Exponent:** 2.38
**Data Points:** 20
**Date Range:** 2005-01-01 to 2024-01-01
**Log Residual Std Dev:** 0.0368
**Data Source:** World Bank API (IT.NET.USER.ZS)
**Genesis Date:** 1983-01-01 (Provided)
**Power Law Fit:** Value ~= 8.467e-09 * t^2.3786
Saturation Analysis (S-Curve Detection):
**⚡ POWER-LAW GROWTH** (Not saturating)
**Sigmoid R²:** 0.9951 vs Linear R²: 0.9913
**Current Value:** 40.4% of sigmoid model maximum
**Assessment:** No evidence of saturation or S-curve behavior
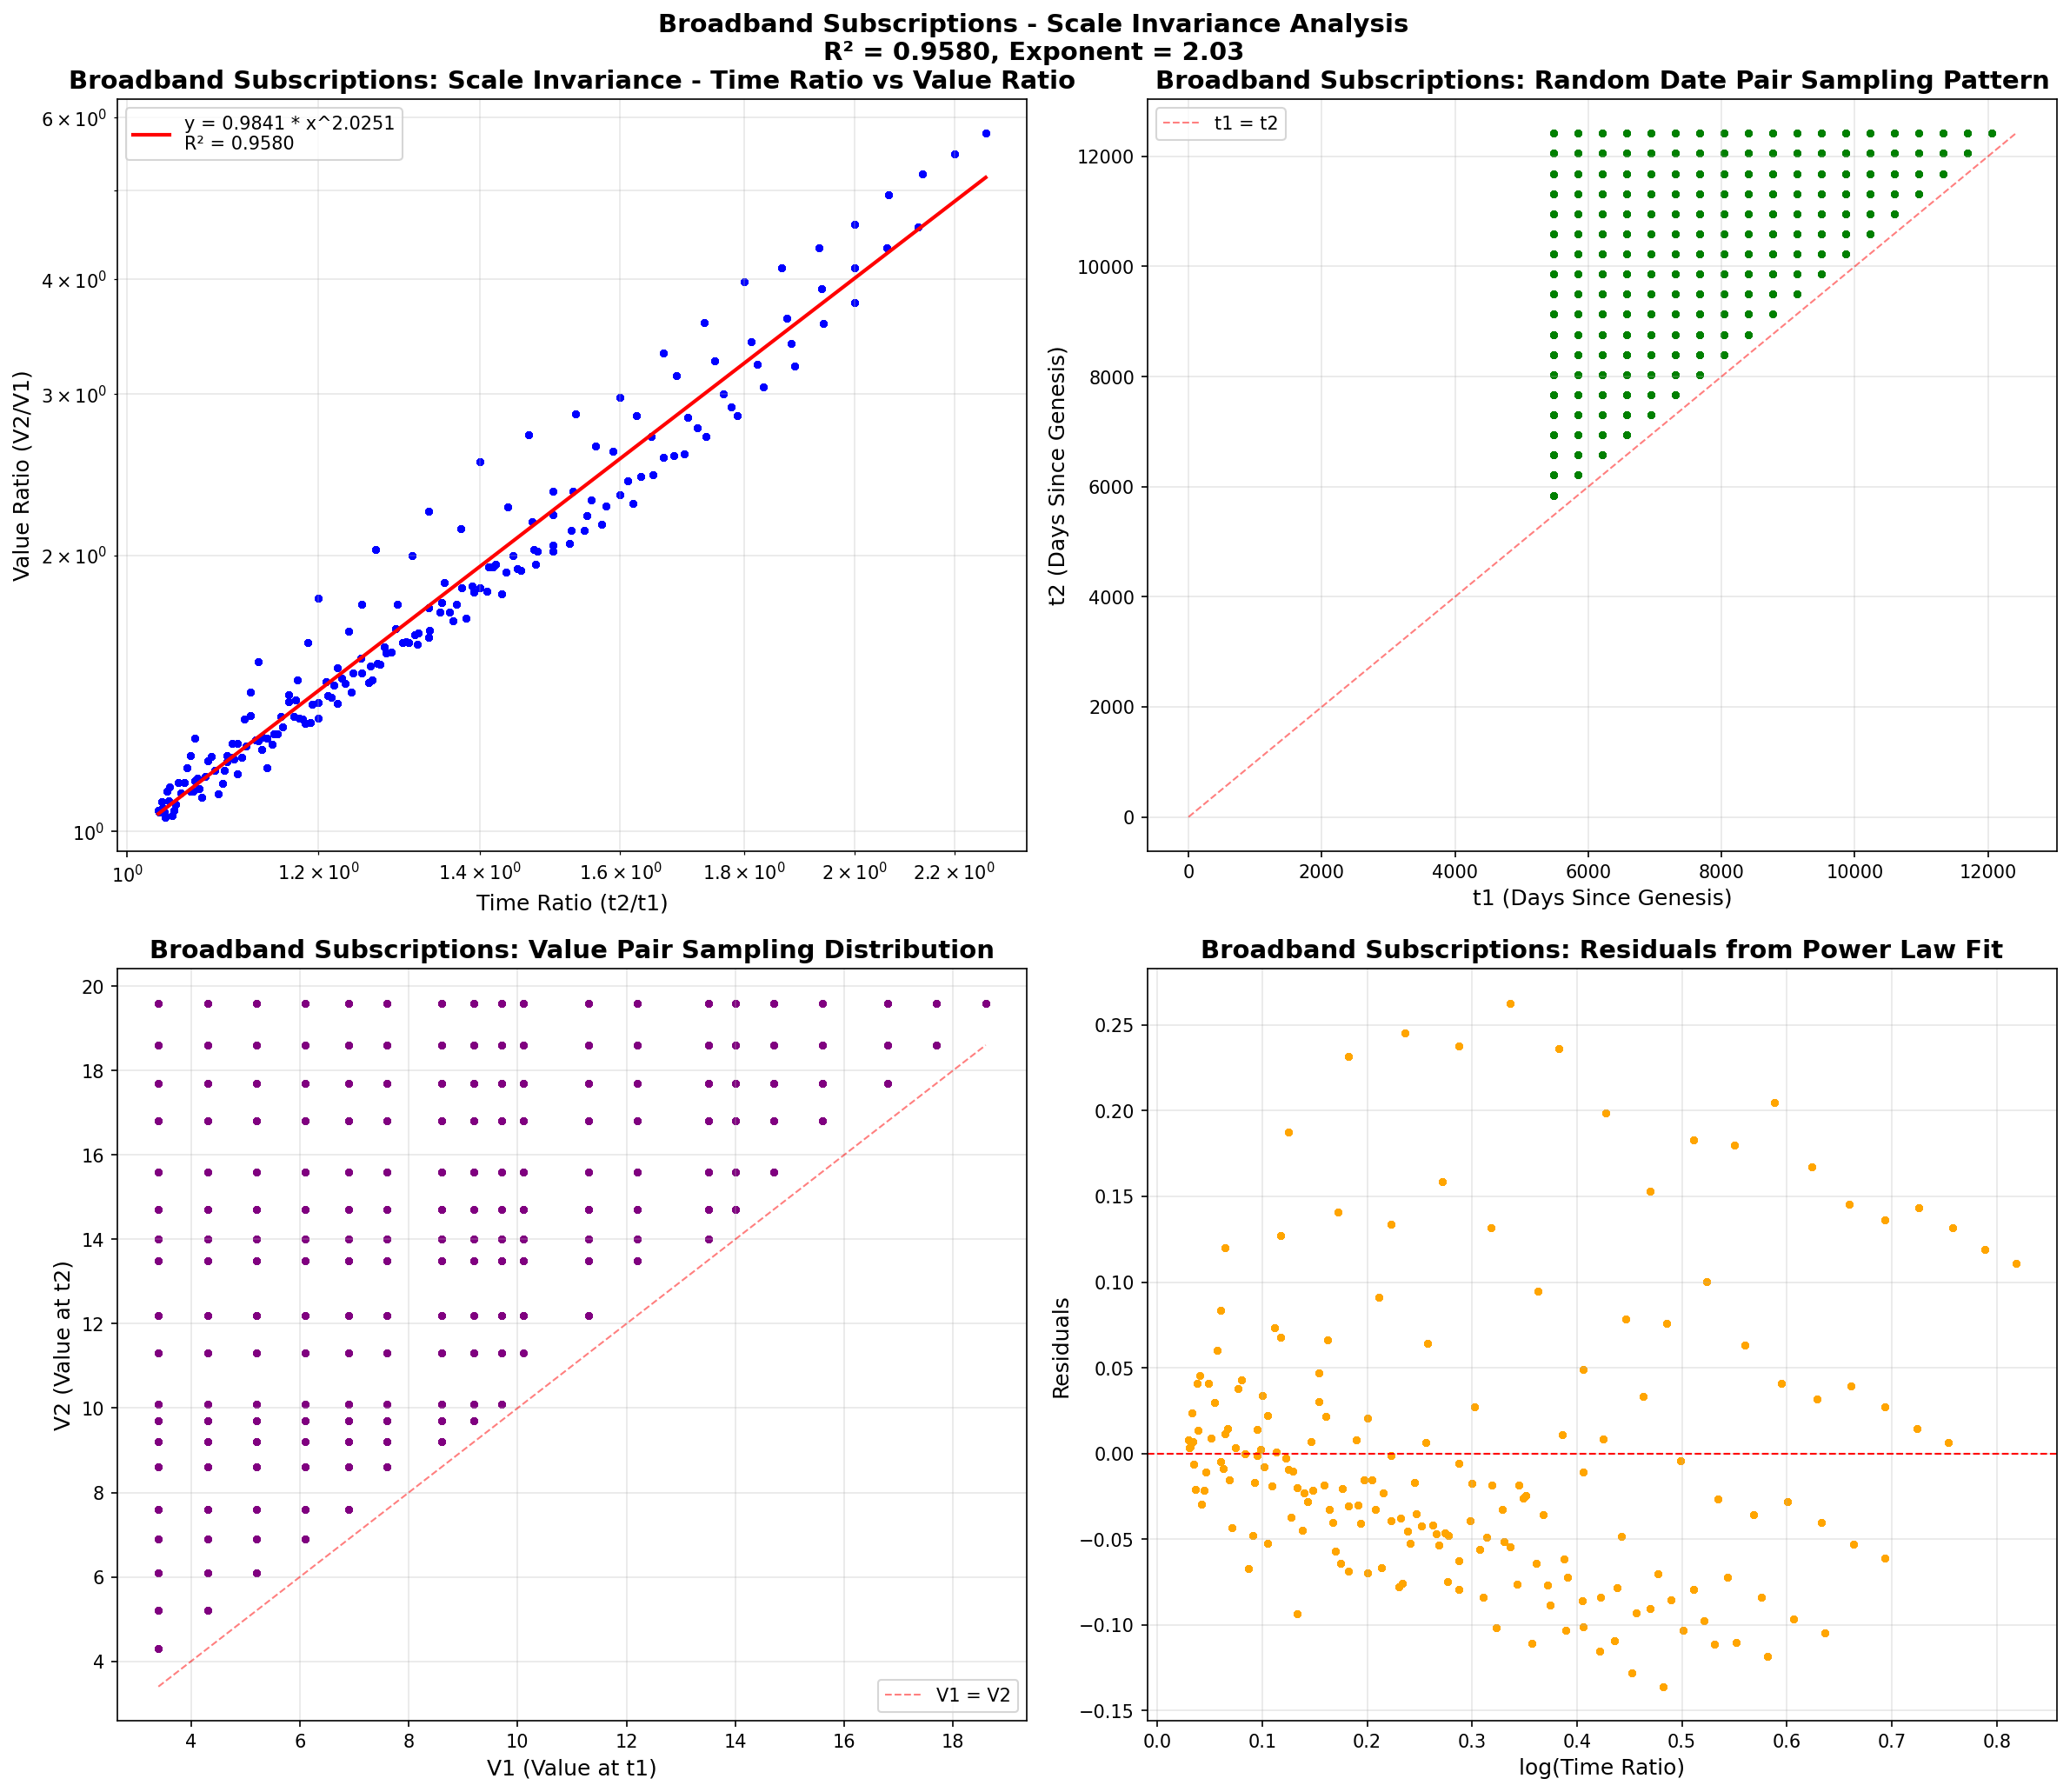
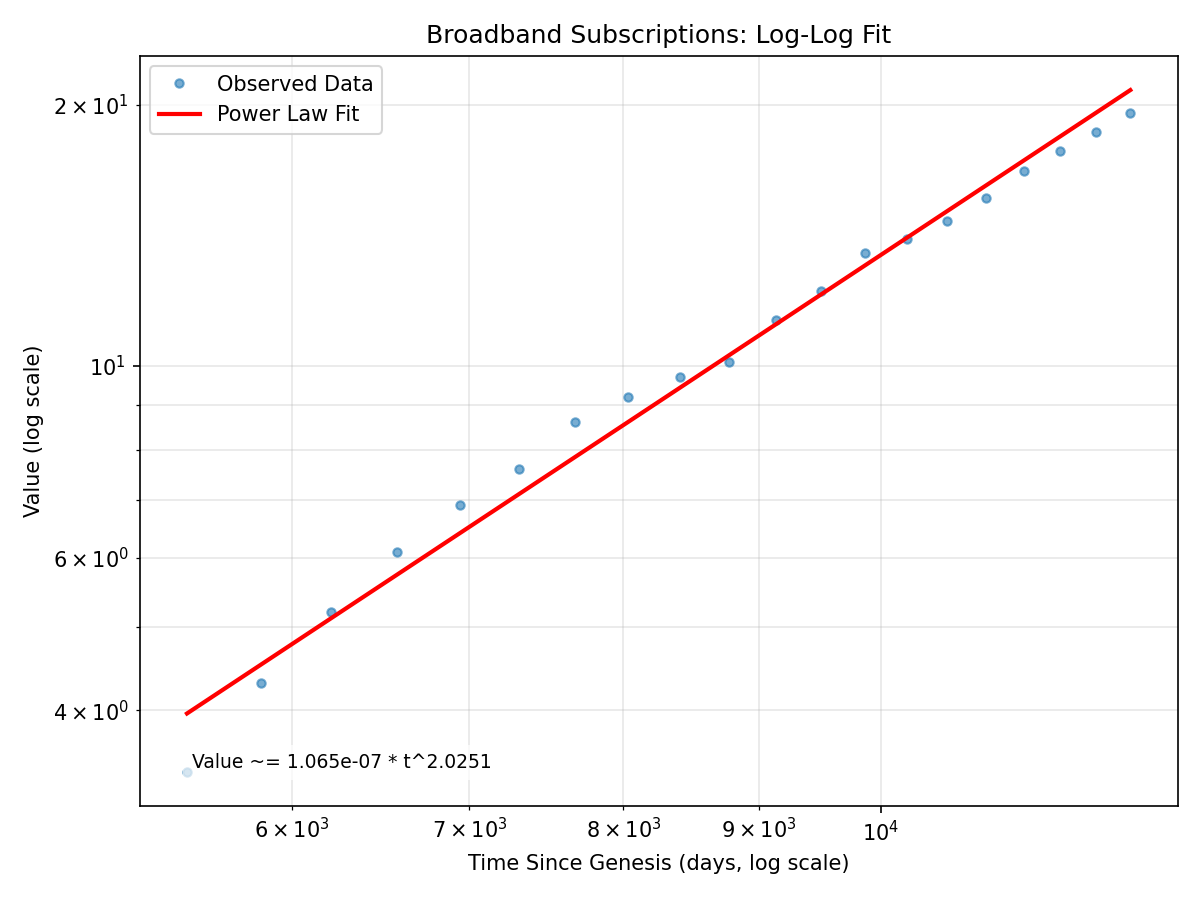
Broadband Subscriptions
**R² (Scale Invariance):** 0.9580
**Power Law Exponent:** 2.03
**Data Points:** 20
**Date Range:** 2005-01-01 to 2024-01-01
**Log Residual Std Dev:** 0.0575
**Data Source:** World Bank API (IT.NET.BBND.P2)
**Genesis Date:** 1990-01-01 (Provided)
**Power Law Fit:** Value ~= 1.065e-07 * t^2.0251
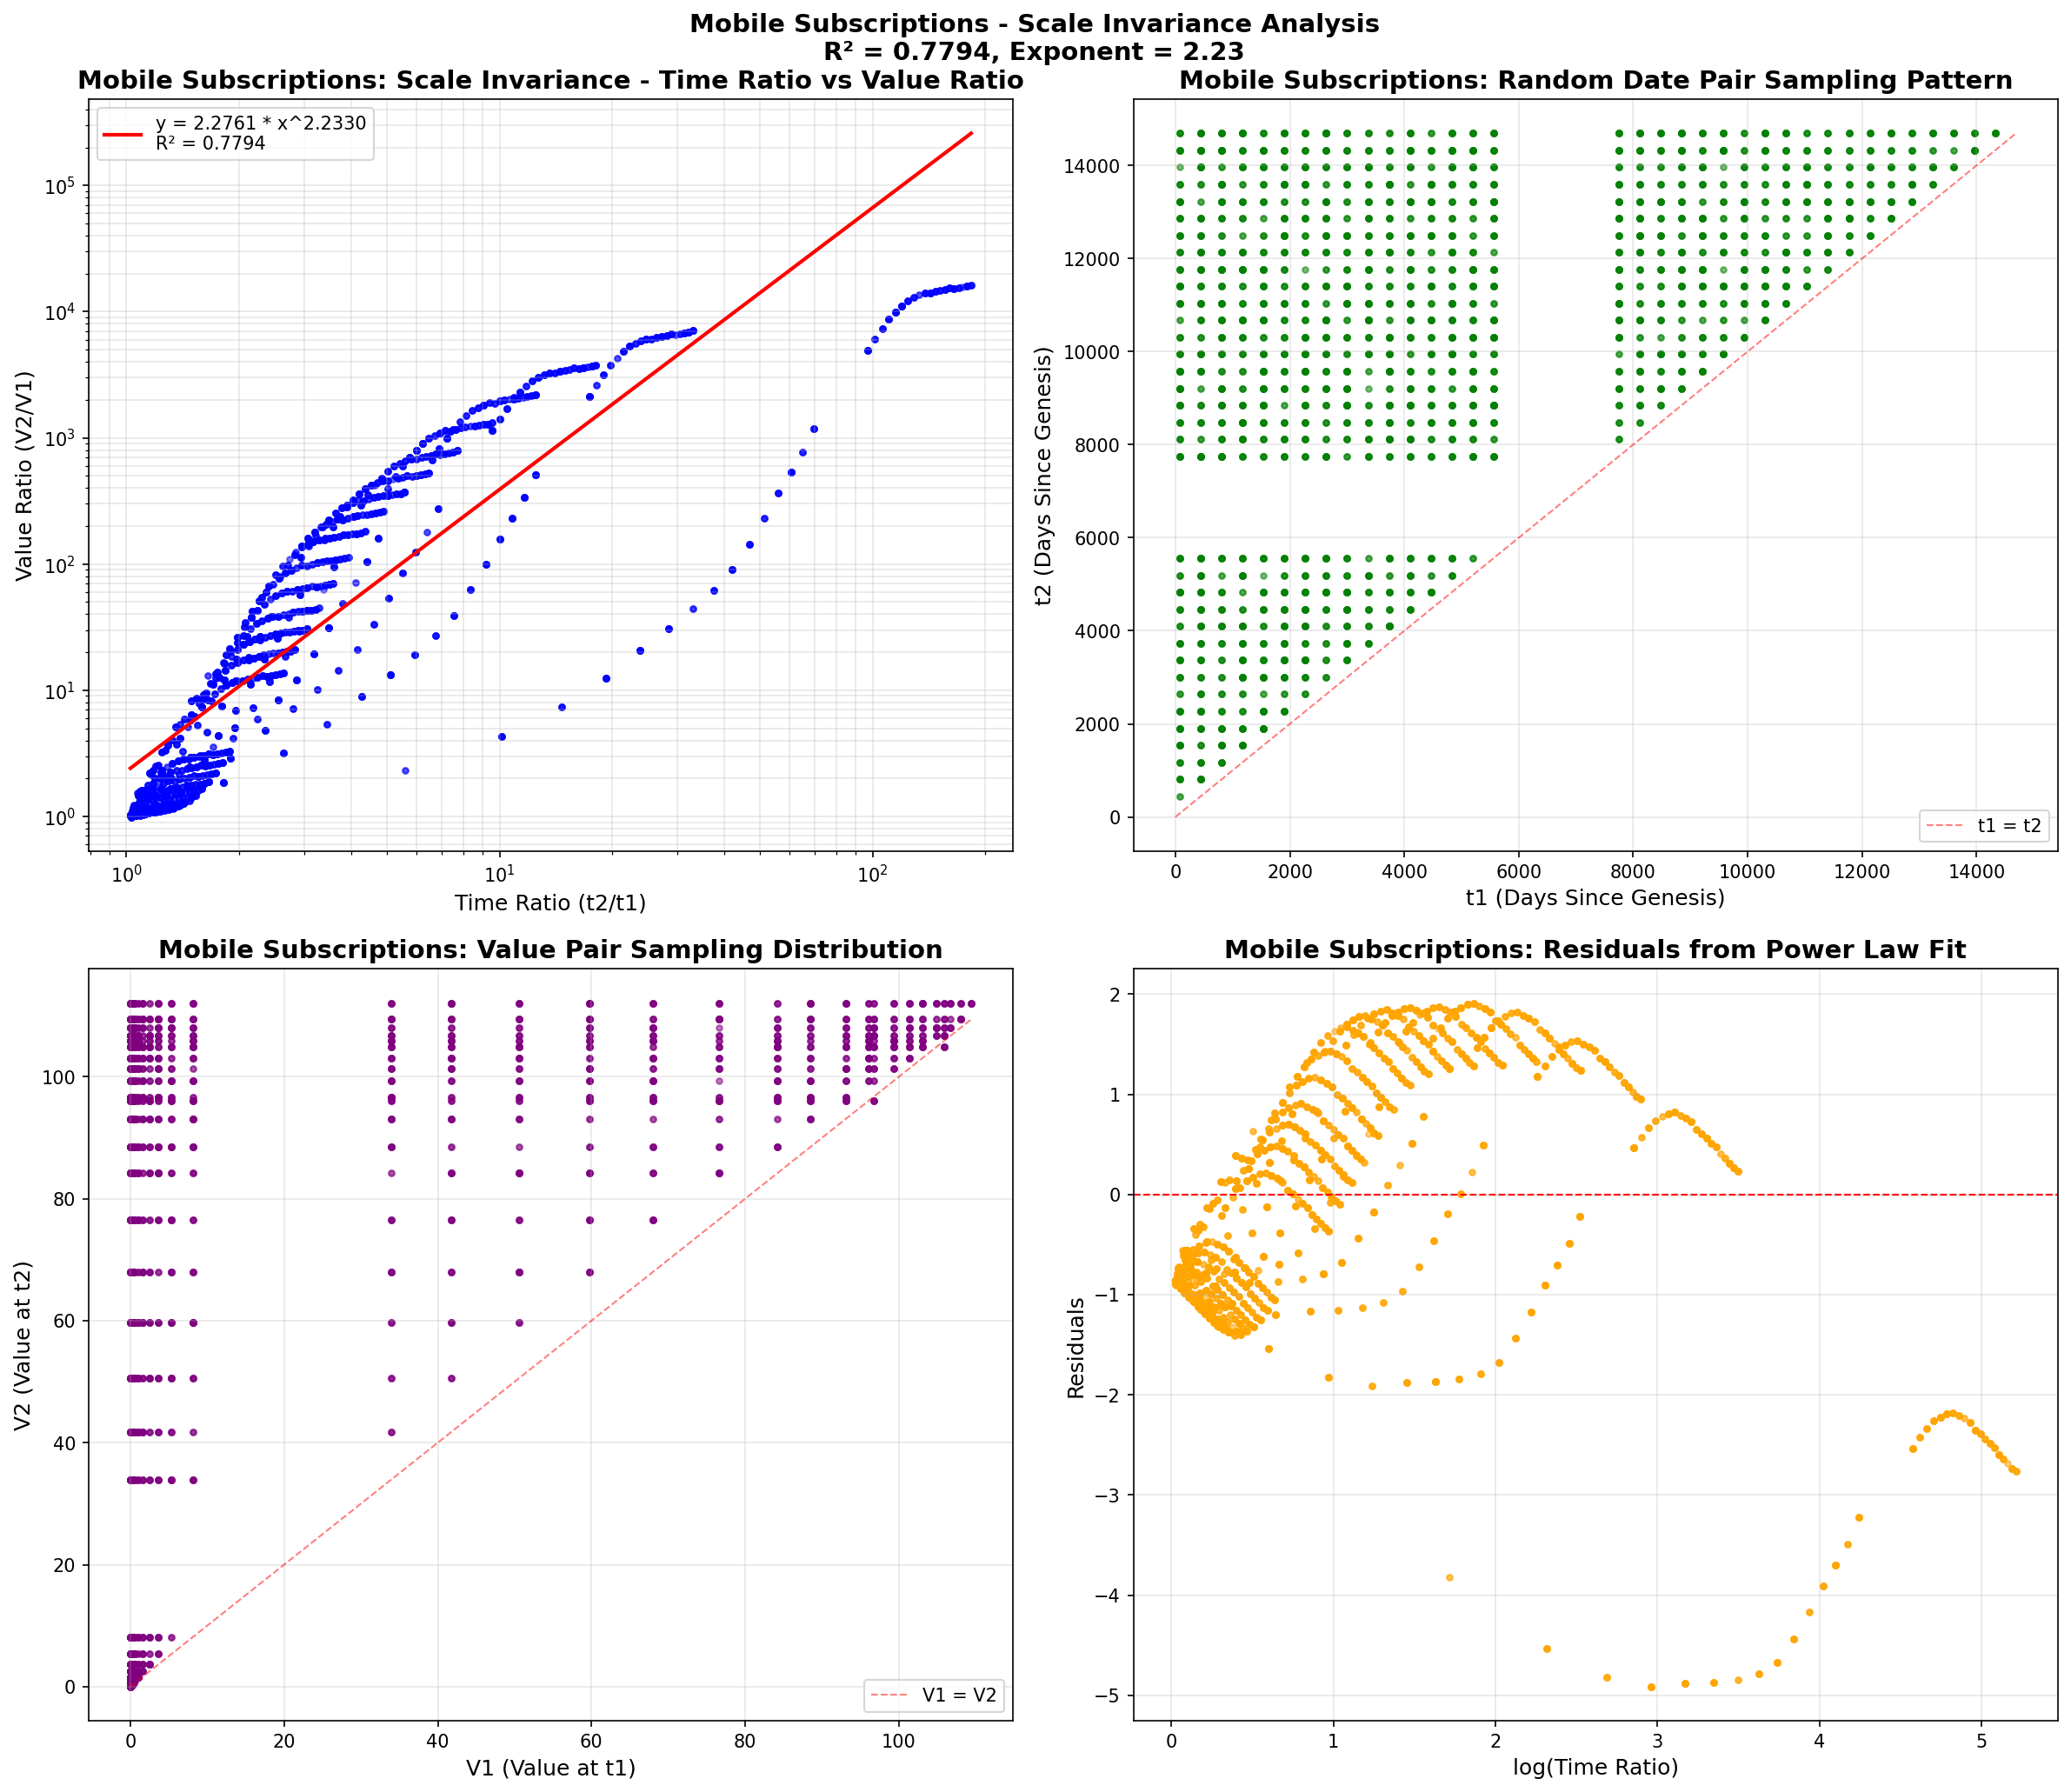
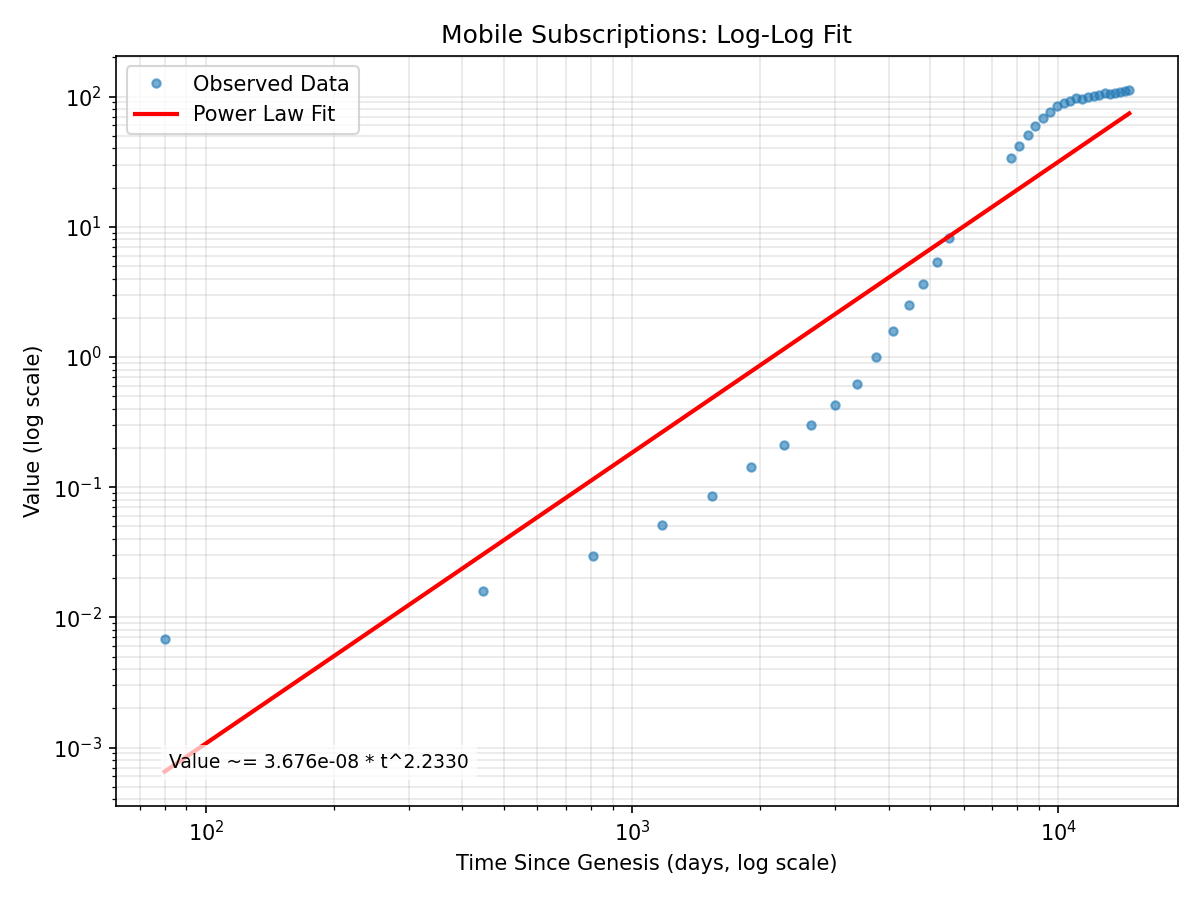
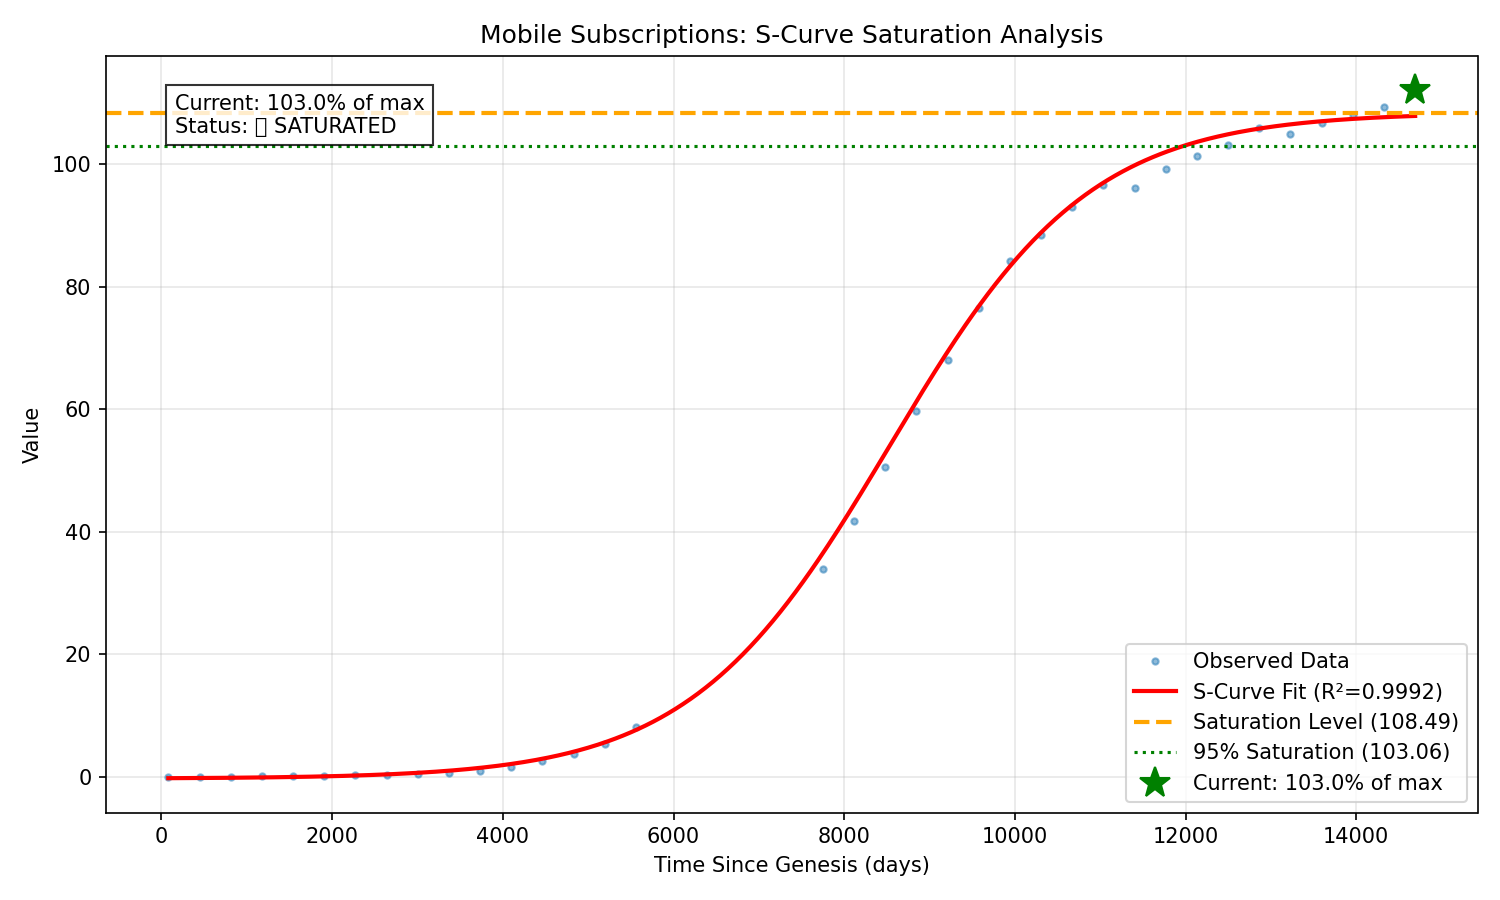
Mobile Subscriptions
**R² (Scale Invariance):** 0.7794
**Power Law Exponent:** 2.23
**Data Points:** 36
**Date Range:** 1984-01-01 to 2024-01-01
**Log Residual Std Dev:** 1.0850
**Data Source:** World Bank API (IT.CEL.SETS.P2)
**Genesis Date:** 1983-10-13 (Provided)
**Power Law Fit:** Value ~= 3.676e-08 * t^2.2330
Saturation Analysis (S-Curve Detection):
**📈 S-CURVE DETECTED** (Sigmoid R² = 0.9992 vs Linear R² = 0.9330)
**Current Progress:** 103.0% of estimated maximum
**Saturation Level:** 1.09e+02 (estimated carrying capacity)
**✅ HAS REACHED SATURATION** (≥95% of maximum)
**Growth Pattern:** Decelerating (61.4% slowdown in recent period)
Data Sources
All data downloaded from live APIs:
**Yahoo Finance API**: Financial assets (stocks, crypto, ETFs)
Data cached in `data_cache/` directory
Each cache file includes metadata with source URL and download date
Methodology
Scale invariance is measured by:
1. Selecting random pairs of dates (t₁, t₂)
2. Computing time_ratio = (t₂ - t₀) / (t₁ - t₀)
3. Computing value_ratio = V(t₂) / V(t₁)
4. Fitting power law in log-log space
5. Measuring R² (goodness of fit)
High R² (>0.95) indicates true scale invariance and power law behavior.