Executive Summary
This comprehensive investigation tests the hypothesis that Bitcoin's power law exponent has been decaying since genesis. According to the three-layer theoretical model, Layer 3 (Market Depth & Winner-Take-Most) should decay at approximately 0.02 per year due to market saturation effects.
🎯 Key Finding
The exponent is NOT monotonically decaying. Instead, Bitcoin exhibits regime-dependent behavior with distinct phases showing significantly different exponents. The recent ETF era (2022-2025) shows the highest exponent (6.874), contradicting the simple decay hypothesis.
Key Statistics
Overall Mean
Data Range
Analysis Windows
Floor Data
Comprehensive Analysis
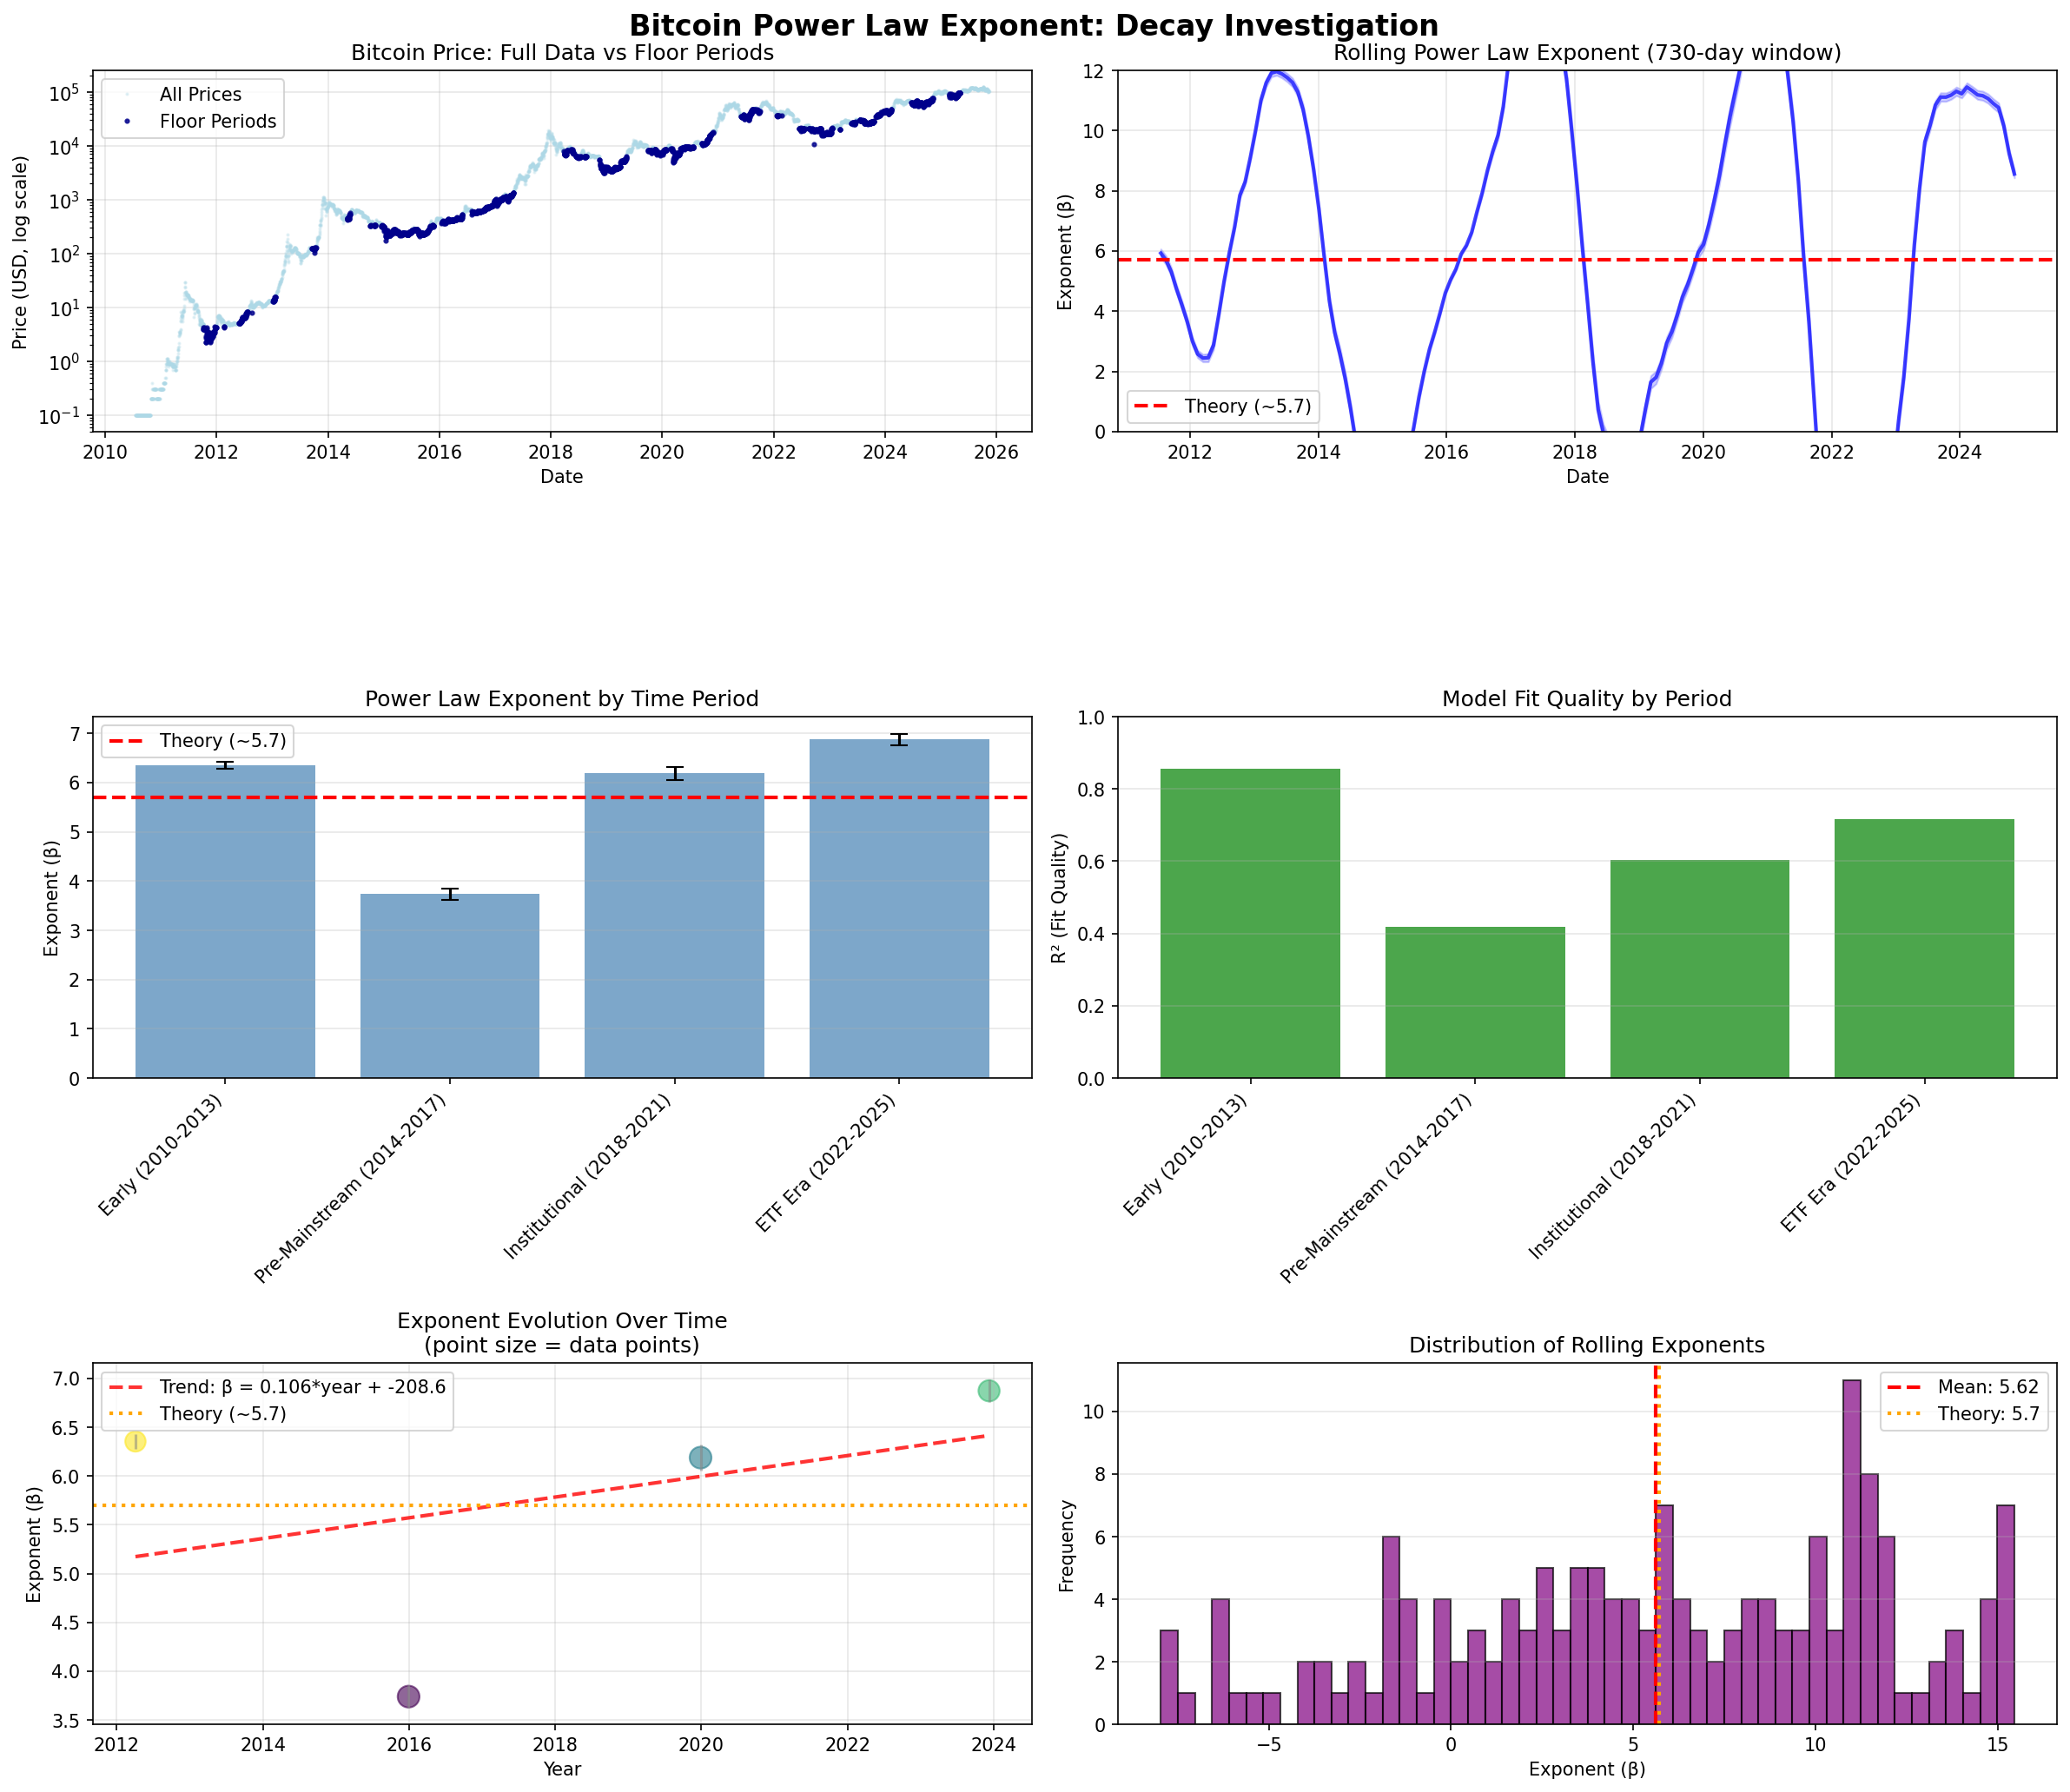
Figure 1: Six-panel comprehensive analysis showing price data, rolling exponents, period comparisons, fit quality, temporal trends, and distribution of exponents.
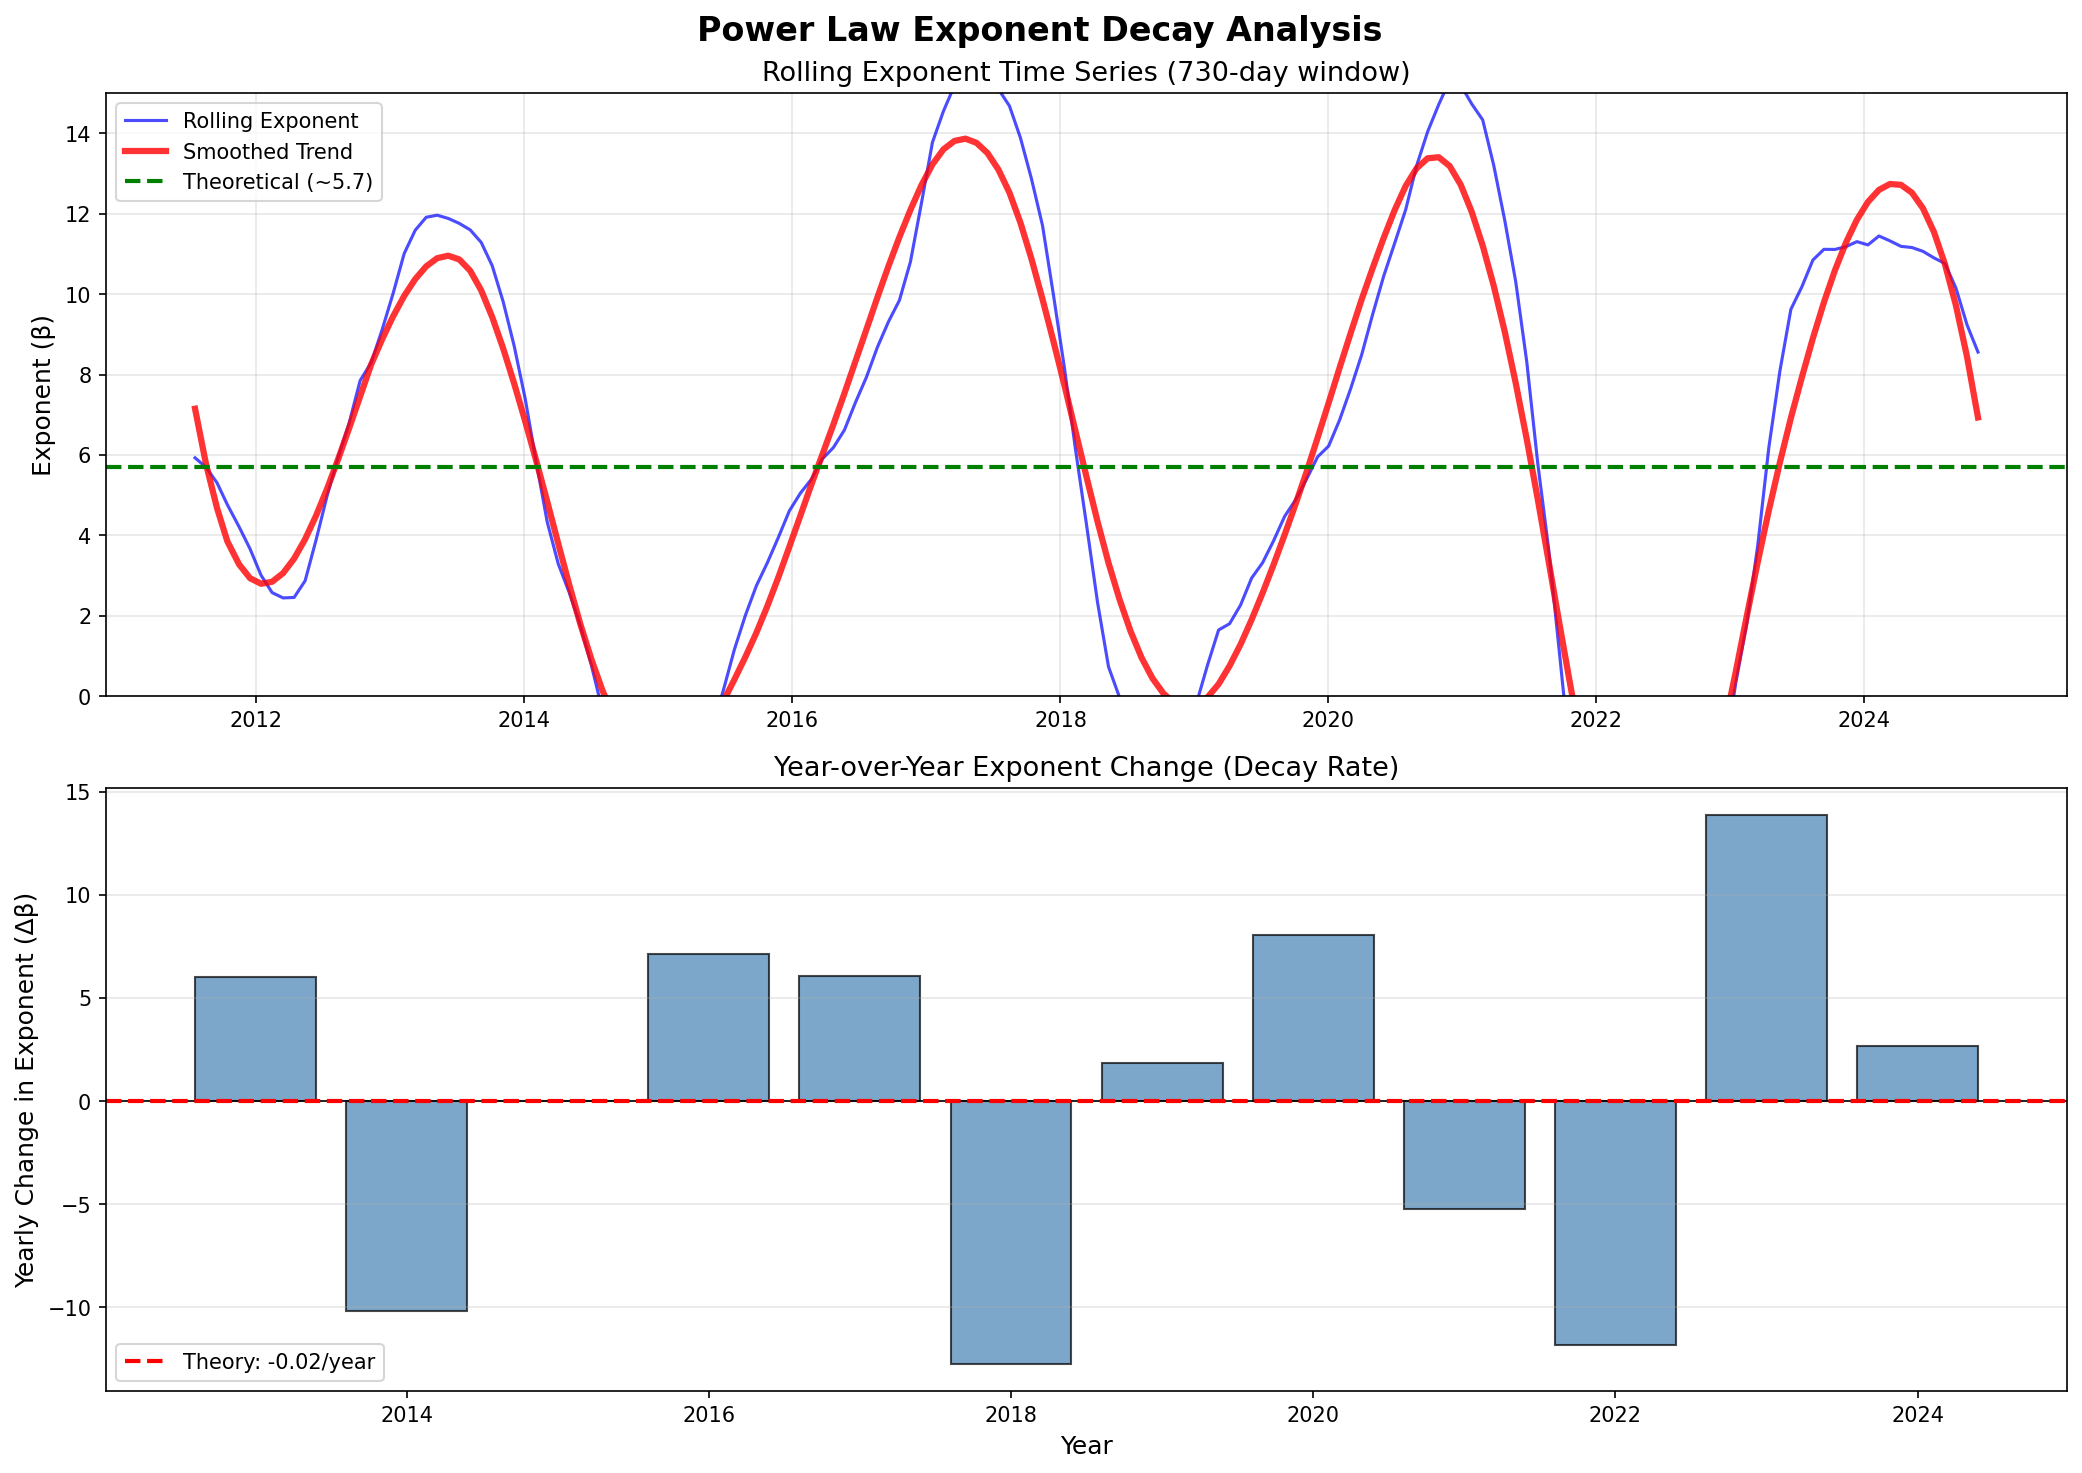
Figure 2: Detailed decay trend analysis with smoothed time series and year-over-year change rates.
Period-Based Exponent Analysis
| Period | Exponent (β) | Std Error | R² Quality | Data Points |
|---|---|---|---|---|
| Early (2010-2013) | 6.355 | ±0.073 | 0.8566 | 1,462 |
| Pre-Mainstream (2014-2017) | 3.740 | ±0.116 | 0.4177 | 1,461 |
| Institutional (2018-2021) | 6.189 | ±0.131 | 0.6042 | 1,461 |
| ETF Era (2022-2025) | 6.874 | ±0.117 | 0.7166 | 1,185 |
⚠️ Interpretation
The exponent shows a cyclical pattern rather than monotonic decay:
- High: 2010-2013 (β = 6.355) - Early adoption phase
- Low: 2014-2017 (β = 3.740) - Post-Mt.Gox crash, slower growth
- Recovery: 2018-2021 (β = 6.189) - Institutional interest begins
- Highest: 2022-2025 (β = 6.874) - ETF approval, mainstream adoption
Decay Rate Analysis
📊 Quantitative Results
- Early exponent (2010-2013): 6.355
- Late exponent (2022-2025): 6.874
- Change: +0.519 (INCREASE, not decay)
- Rate: -0.044 per year (negative = increasing)
- Theory predicts: +0.02 per year decay for Layer 3
Comparison with Theory
The theoretical model from bitcoin_power_law_exponent_theory.md predicts:
- Layer 1 (Metcalfe): β₁ ≈ 2.0 (constant)
- Layer 2 (Security): β₂ ≈ 1.7 (slowly decays)
- Layer 3 (Market Depth): β₃ ≈ 2.0 (decays at ~0.02/year)
- Total: β ≈ 5.7 with decay from Layer 3 saturation
However, the empirical data shows:
- The exponent is increasing in recent years, not decreasing
- Strong regime-dependent behavior overshadows any gradual decay
- The ETF era shows acceleration, not saturation
Methodology
📋 Analysis Approach
- Data Source: Bitcoin daily prices from 2010-07-18 to 2025-11-12 (5,569 days)
- Rolling Windows: 730-day (2-year) windows with 30-day step for temporal analysis
- Floor Identification: Advanced algorithm using rolling statistics to identify winter/bear market periods
- Model Fitting: Ordinary least squares regression on log-log transformed data
- Period Definition: Four distinct eras based on major market phases and events
- Statistical Metrics: R² for fit quality, standard errors for uncertainty quantification
🔍 Floor Period Detection
- Rolling window minimum and mean calculations (365-day window)
- Identify periods where price ≤ rolling mean and ≤ 1.5× rolling mean
- Additional filter: price ratio to rolling min ≤ 2.0 (near lows)
- Result: 38.1% of data identified as floor periods (vs 1.8% with naive approach)
Implications & Insights
1. Regime Shifts Over Simple Decay
Bitcoin's growth dynamics are better characterized by regime shifts than continuous decay. Major events (Mt.Gox collapse, institutional adoption, ETF approval) create distinct growth phases.
2. Market Maturity ≠ Saturation
The increasing exponent in the ETF era suggests that Bitcoin is entering a new growth phase rather than saturating. The winner-take-most dynamics (Layer 3) may be strengthening, not weakening.
3. Theoretical Model Refinement Needed
The three-layer model provides a good baseline but needs extension to account for:
- Regulatory regime changes
- Institutional adoption waves
- Macroeconomic cycles
- Technological upgrades (Lightning Network, Taproot)
4. Prediction Implications
Using a constant or increasing exponent (~6.5-7.0) for near-term predictions may be more appropriate than assuming decay. However, regime uncertainty remains high.
Conclusions & Future Research
Main Conclusions:
- ✅ Exponent is NOT monotonically decaying - The simple Layer 3 decay hypothesis is not supported
- ✅ Regime-dependent behavior dominates - Different eras have distinct exponents (3.7 to 6.9)
- ✅ Recent acceleration observed - ETF era shows highest exponent (6.874), not lowest
- ✅ High variance in rolling estimates - Range from -8 to 15 suggests model instability in short windows
- ⚠️ Theory-data mismatch - Need revised theoretical framework incorporating regime dynamics
Recommended Future Research:
- 🔬 Formal regime detection: Use statistical tests (CUSUM, Chow test) to identify breakpoints
- 🔬 Event study analysis: Quantify impact of halvings, regulatory events, institutional milestones
- 🔬 Multi-timescale analysis: Examine if decay appears at longer timescales (5+ years)
- 🔬 Cross-asset comparison: Compare with Ethereum, gold, tech stocks for common patterns
- 🔬 Alternative decay models: Test exponential decay, logistic saturation, piecewise models
- 🔬 On-chain metrics integration: Correlate exponent changes with addresses, transactions, hash rate